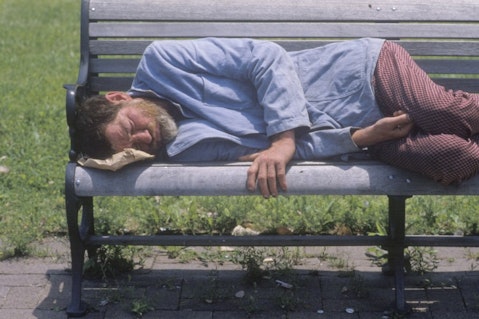
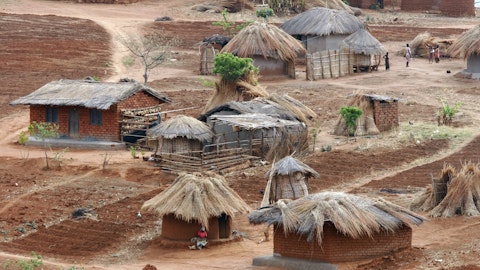
While the American economy is making steady progress, it’s still too slow for these 16 poorest metropolitan cities in America – according to this 2015 list. It shouldn’t come as a surprise that some cities, towns and neighborhoods across the US don’t exhibit a healthy growth. With lower salaries and higher unemployment rates, come greater percentage of people living close to or even below the poverty line. Crime rates and percentage of people moving out of such metro areas are also soaring upward as a result. You can’t blame the people for looking for greener pastures. They have to secure their livelihood, and the best way to do so is often moving away.

Joseph Sohm / Shutterstock.com
If you think that it’s only grim in the US, you’re wrong. If you’re living in one of the cities that will make their way to this list further down, know that it can always be worse. Of course, it can be better, but at least, it’s not like in these 7 poorest countries in the world by 2015 GDP, where people survive on less than $1 per hour. Salaries across the US are still much higher than that but overall, they don’t necessarily have to be above the minimal margin. After all, how can they be if some individuals are earning less than $11,770 a year, or if 4-person family is earning less than $24,250 as shown in this report? Remember, however, that these are only poverty thresholds, and that quality of life won’t drastically improve if one’s slightly above it. It’s just a number used for statistical purposes, but the truth is much more complex than that.
In order to compile this list, we have resorted to a combination of criteria. You’ll agree that metro area’s well-being depends on high average salaries, low unemployment rates and, of course, low percentage of inhabitants living in poverty. Needless to say, poorest metropolitan statistical areas exhibit exactly the opposite – low salaries, and high unemployment and poverty rates. This is why we have decided to use average GDP per capita, unemployment and poverty rates for American metropolitan areas as our criteria. Per capita real GDP by metropolitan area can be obtained from Bureau of Economic Analysis, and we have decided to use data for the last couple of available years in order to get continuity as well. Unemployment rates have been pulled from the latest Bureau of Labor Statistics report, while poverty rates across the country can be found in this Congressional Research Service report (starting on page 52). Metro areas across the country will be assigned points from 1 to 10 for all three criteria. Metros with the highest score in the end will make this 16 poorest metropolitan cities in America: 2015 list. Finally, only metro areas with more than 500,000 inhabitants have been taken into account since we’re talking cities here.

