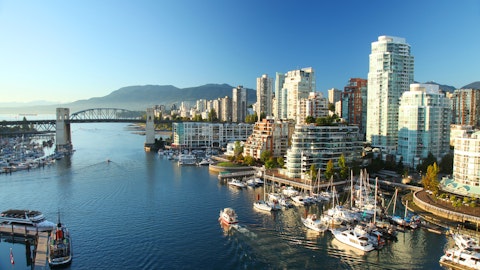
Today we present you 10 hardest cities to find a job in 2016, places anyone who is searching for a job should avoid. Half of listed cities have unemployment rates above the national average of 4.9; two cities recorded job growth less than one percent while the smallest hourly wage among listed places was $21.34.
In our previous ranking 10 easiest cities to find a job in 2016 we presented the latest report form the Bureau of Labor Statistics, which shows that US economy has been steadily recovering from the recession. Number of new job openings peaked in 2015, the ratio between unemployed people and available jobs declined to 1.4 while separations are near pre-recession levels. Today’s ranking shows the other side of the US job market.
FEMA/ Michael Raphael
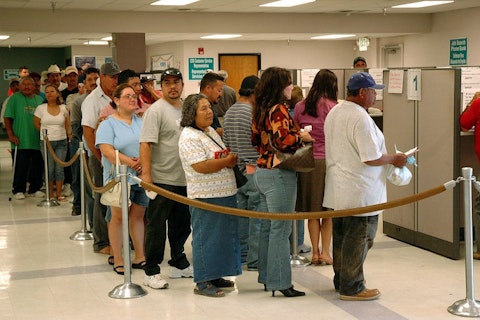
High unemployment in listed areas is not a result of negative job growth but the fact that millions of positions which were lost during the recession cannot be reclaimed at faster rates. Unemployment rate movements in California, the state in which three of ranked cities are located, reflect the struggles of US economy to overcome the effects of the recession. In pre-recession 2006, the state’s unemployment rate was 4.9. During the next four years, it sharply raised reaching a historical high of 12.4 in 2010. Since then the percent of people out of work steadily declined and at the end of 2015, 5.8 percent of working-age Californians did not have a job. Although state’s unemployment rate is still above the national average, it is significantly lower compared to recessional years. During last year around 180,000 new positions were added to the California job market, while only one sector, mining and logging, recorded negative employment growth by losing 9,600 jobs.
In creating the list of 10 easiest cities to find a job in 2016, we used rankings made by Indeed and WalletHub. Indeed, which gathers job postings from 1000’s websites, made a list of 50 US cities with the highest number of job openings per capita, while WalletHub based its ranking of job markets using 8 different criteria, including employment growth and opportunities, unemployment rate, industry variety and so on. We found most populous cities that appear on both lists and listed them by average ranking. We also present you each city’s unemployment rate and job growth (data taken from the BLS) and average hourly wage for December 2015.
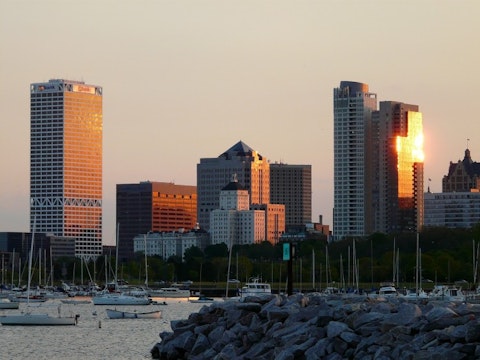
10. Milwaukee, WI
Milwaukee-Waukesha-West Allis
Indeed Rank: 25
WalletHub rank: 122
Average rank: 73.5
Population: 1,572,245
Unemployment rate: 4.5
Average hourly earnings: $25.68
Job growth rate 2015: 0.8
In the last twelve months, six sectors recorded negative job growth in Milwaukee. Around 7.600 jobs were lost, mainly in manufacturing (2,100) and other services (2,200). On the other side, the number of employed residents grew by 6,900, or in other words less than one percent, while the greatest share of new job openings occurred in professional and business services (6,700). A job growth rate of 0,8 is second-smallest among listed places.
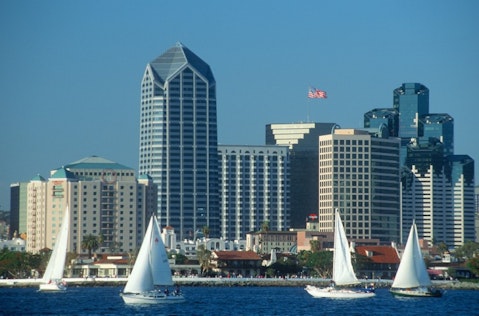
9. San Diego, CA
Indeed Rank: 39
WalletHub rank: 111
Average rank: 75
Population: 3,263,431
Unemployment rate: 4.7
Average hourly earnings: $27.57
Job growth rate 2015: 2.7
At the end of 2015, around 74,400 San Diego’s residents were out of work, which accounted for 4.7 unemployment rate. However, compared to other listed places, the area recorded steady job gains. In the last twelve months 40,000 new positions have been added to the job market, while around 2,500 jobs have been lost. Moreover, the area has one of largest average hourly wages among ranked places.
Joseph Sohm/Shutterstock.com
8. Philadelphia, PA
Philadelphia-Camden-Wilmington
Indeed Rank: 126
WalletHub rank: 28
Average rank: 77
Population: 6,051,170
Unemployment rate: 4.1
Average hourly earnings: $27.62
Job growth rate 2015: 1.3
At the end of 2015, the unemployment rate in Philadelphia was 4.1, which is significant decrease compared to July 2015, when it was 6.1. At the same time, the number of employed residents in the metro area increased by 1.3 percent (35,500 people). However, it should be noted that the city of Philadelphia recorded poor job growth, which was estimated at 0.5 percent at the end of 2015. In four sectors (mining, manufacturing, leisure and hospitality, and government) 3,700 jobs were lost. Significant employment increase occurred only in trade, transportation and utilities, where 4,200 new jobs were added.

mandritoiu/Shutterstock.com
7. Birmingham, AL
Birmingham-Hoover
Indeed Rank: 37
WalletHub rank: 120
Average rank: 78.5
Population: 1,143,772
Unemployment rate: 5.3
Average hourly earnings: $23.77
Job growth rate 2015: 1.0
Around 28,400 people were without a job in Birmingham, which is almost 4,000 less than in July 2015. Although the unemployment rate dropped down from 6.0 to 5.3, it is still above the national average of 4.9. In the last twelve months, the number of available jobs has grown by one percent, mainly because 2,600 new jobs have been added to the construction job market. At the same time, around 3,600 positions were lost, almost half of which in manufacturing.
6. Los Angeles, CA
Los Angeles-Long Beach-Anaheim
Indeed Rank: 127
WalletHub rank: 42
Average rank: 84.5
Population: 13,262,220
Unemployment rate: 5.4
Average hourly earnings: 27.00
Job growth rate 2015: 2.3
The second most populated metro area in the US, Los Angeles, had 28,400 unemployed residents at the end of 2015. Like in Birmingham, the unemployment rate has declined in last six months but remains above the national average. The good thing though is that the area recorded one of the highest job growth among listed places – almost 142,000 new jobs were added while 6,800 were lost. The sector that saw the greatest gains was leisure and hospitality (32,200 jobs). At the same time, information industry lost greatest number of jobs – 3,000.

Sarah Fields Photography/Shutterstock.com
5. Memphis, TN
Indeed Rank: 40
WalletHub rank: 133
Average rank: 86.5
Population: 1,343,230
Unemployment rate: 6.1
Average hourly earnings: $21.44
Job growth rate 2015: 1.4
Memphis occupies the fifth spot on our list of 10 hardest cities to find a job in 2016. The area has the highest unemployment rate – 38,000 jobless residents account for 6.1 percent of the total workforce. In the period between December 2014 and December 2015, 2,400 jobs were lost. Still, the whole area recorded positive job growth mainly because 5,400 positions were added in trade, transportation, and utilities. Finally, employees in Memphis earn the second-smallest average hourly wage among listed places.

Larry Donald, U.S. Army Corps of Engineers
4. Buffalo, NY
Buffalo-Cheektowaga-Niagara Falls
Indeed Rank: 44
WalletHub rank: 135
Average rank: 89.5
Population: 1,136,360
Unemployment rate: 4.9
Average hourly earnings: $23.22
Job growth rate 2015: 1.1
In December 2015, the unemployment rate was at the level of the national average in Buffalo. The number of employed residents grew by 1.1 percent, or in other words the area had 6,100 more employees compared to a year ago. Gains in education and health sector (4,000 new jobs) greatly contributed to the overall growth. On the other side, the government lost the greatest number of positions – 1.000.

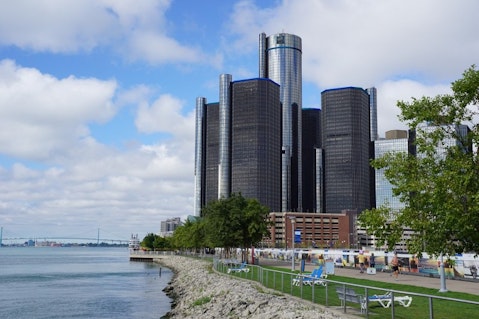
3. Detroit, MI
Indeed Rank: 33
WalletHub rank: 148
Average rank: 90.5
Population: 4,296,611
Unemployment rate: 5.4
Average hourly earnings: $24.73
Job growth rate 2015: 2.1
Although Detroit recorded significant progress in reducing unemployment rate (between July 2015 and December 2015 the percent of jobless residents declined from 7.0 percent to 5.4), the percent of people out of work is still above the national average. More than 40,000 new positions were added, primarily to the professional and business services. Two sectors, government and information, recorded negative employment growth losing around 4,500 positions.
2. Riverside, CA
Riverside-San Bernardino-Ontario
Indeed Rank: 45
WalletHub rank: 138
Average rank: 91.5
Population: 4,441,890
Unemployment rate: 5.9
Average hourly earnings: $21.34
Job growth rate 2015: 3.6
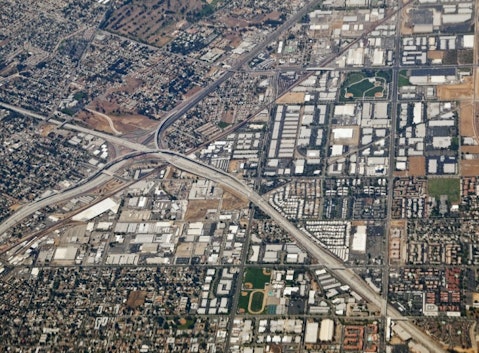
Riverside has the second-highest unemployment rate among listed places. At the end of 2015, around 116,700 people did not have a job. However, the area recorded highest job growth rate on this list. Around 50,000 new jobs were created, while around 2,000 positions were lost. Among the industries that recorded gains, construction, and trade and transportation lead with 9,000 new jobs.
trekandshoot/Shutterstock.com
1. Providence, RI
Providence-Warwick
Indeed Rank: 46
WalletHub rank: 146
Average rank: 96
Population: 1,609,367
Unemployment rate: 4.9
Average hourly earnings: $24.80
Job growth rate 2015: 2.1
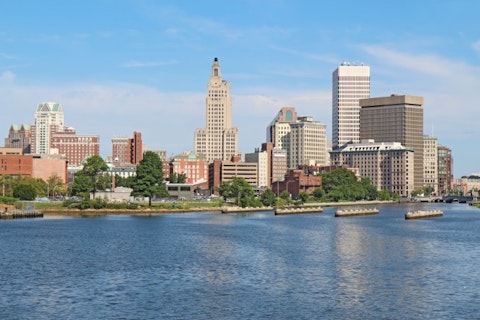
Providence ranks first among 10 hardest cities to find a job in 2016. The unemployment rate of 4.9 is at the level of the national average while the whole area recorded job growth of 2.1 percent. Out of 13,000 jobs that were opened during 2015, greatest share occurred in professional and business services (4,800) and leisure and hospitality (3,500). At the same time, information sector and the government lost together 1,100 positions.
Stephen B. Goodwin/Shutterstock.com


