Medtronic, Inc. (NYSE:MDT) recently reported its preliminary financial results based on which we provide a unique peer-based analysis of the company. Our analysis is based on the company’s performance over the last twelve months (unless stated otherwise). For a more detailed analysis of this company (and over 40,000 other global equities) please visit www.capitalcube.com.

Medtronic Inc.’s analysis versus peers uses the following peer-set: Johnson & Johnson (NYSE:JNJ), Baxter International Inc. (NYSE:BAX), Stryker Corporation (NYSE:SYK), Zimmer Holdings, Inc. (NYSE:ZMH), Edwards Lifesciences Corp (NYSE:EW), St. Jude Medical, Inc. (NYSE:STJ), Boston Scientific Corporation (NYSE:BSX) and Owens & Minor, Inc. (NYSE:OMI). The table below shows the preliminary results along with the recent trend for revenues, net income and returns.
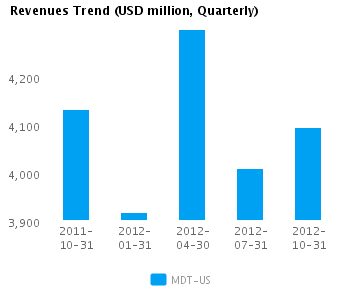
| Quarterly (USD million) | 2012-10-31 | 2012-07-31 | 2012-04-30 | 2012-01-31 | 2011-10-31 |
|---|---|---|---|---|---|
| Revenues | 4,095.0 | 4,008.0 | 4,297.0 | 3,918.0 | 4,132.0 |
| Revenue Growth % | 2.2 | (6.7) | 9.7 | (5.2) | 2.0 |
| Net Income | 646.0 | 864.0 | 888.0 | 845.0 | 871.0 |
| Net Income Growth % | (25.2) | (2.7) | 5.1 | (3.0) | 6.1 |
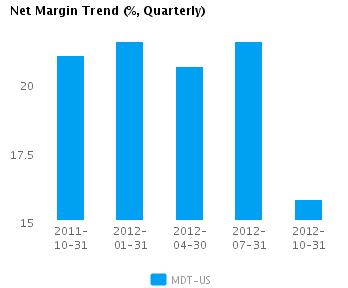
| Net Margin % | 15.8 | 21.6 | 20.7 | 21.6 | 21.1 |
| ROE % (Annualized) | 15.0 | 20.1 | 20.7 | 19.9 | 21.1 |
| ROA % (Annualized) | 7.7 | 10.4 | 10.9 | 10.6 | 11.1 |
Valuation Drivers
Medtronic Inc. currently trades at a higher Price/Book ratio (2.6) than its peer median (1.9). The market expects MDT-US to grow at about the same rate as its chosen peers (PE of 13.2 compared to peer median of 16.3) and to maintain the peer median return (ROE of 19.1%) it currently generates.
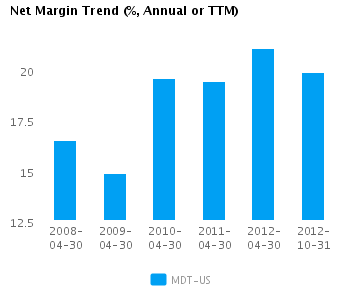
The company attempts to achieve high profit margins (currently 19.9% vs. peer median of 14.6%) through differentiated products. It currently operates with peer median asset turns of 0.5x. MDT-US’s net margin has declined 1.2 percentage points from last year’s high but remains above its five-year average net margin of 18.3.
Economic Moat
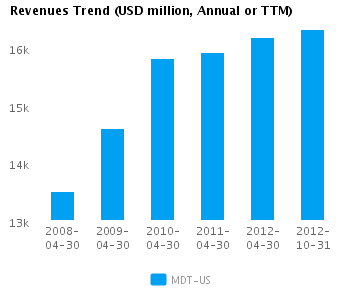
The company’s revenues performance is worse than its peer median (year-on-year change revenue of 1.6%) but its earnings have been relatively good — annual earnings changed by 10.3% compared to the peer median of 8.6%, implying that relative to peers, it is focused on earnings and/or selective about what top-line growth opportunities it pursues. MDT-US currently converts every 1% of change in revenue into 6.5% of change in annual reported earnings.
MDT-US’s return on assets currently is around peer median (9.9% vs. peer median 8.9%) — similar to its returns over the past five years (10.7% vs. peer median 10.7%). This performance suggests that the company has no specific competitive advantages relative to its peers.
The company’s gross margin of 78.6% is around peer median suggesting that MDT-US’s operations do not benefit from any differentiating pricing advantage. However, MDT-US’s pre-tax margin is more than the peer median (24.7% compared to 18.6%) suggesting relatively tight control on operating costs.
Growth & Investment Strategy
MDT-US’s revenues have grown at about the same rate as its peers (3.5% vs. 4.0% respectively for the past three years). Similarly, the stock price implies median long-term growth as its PE ratio is around the peer median of 13.2. The historical performance and long-term growth expectations for the company are largely in sync.
MDT-US’s annualized rate of change in capital of 11.3% over the past three years is around its peer median of 11.3%. This median investment has likewise generated a peer median return on capital of 13.0% averaged over the same three years. This median return on investment implies that company is investing appropriately.
Earnings Quality
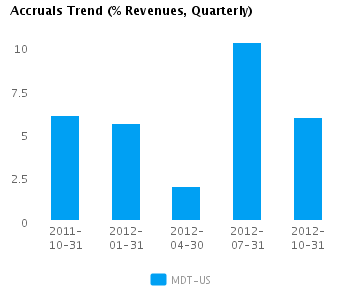
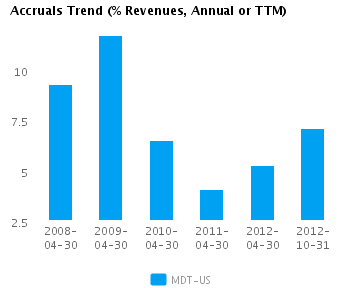
MDT-US has reported relatively strong net income margin for the last twelve months (19.9% vs. peer median of 14.6%). This strong margin performance was accompanied by a level of accruals that was around peer median (7.1% vs. peer median of 7.1%) suggesting that the reported net income is supported by a reasonable level of accruals.
MDT-US’s accruals over the last twelve months are positive suggesting a buildup of reserves. However, this level of accruals is also around the peer median and suggests the company is recording a proper level of reserves compared to its peers.
Trend Charts