A Market Update
Over the last three weeks, we have had a glimpse of how quickly market moods can shift. Looking at the major US equity indices, you can see the euphoria that resulted in the market peaking on February 12, 2020, not only faded quickly but has been replaced with panic and desperation:

If there is one thing that can be said about markets during this tumultuous period, they were not playing favorites, since all of the indices registered double git drops, with the NASDAQ showing the smallest drop.
a. Melting Away – Dollar Value Lost
The focus on the indices can obscure the staggering decline in market values that occurred in a three-week period and in the table below, I chronicle the loss in market value globally, broken down by region.
 |
| Download spreadsheet |
The first four columns look at total market capitalization and the change in both dollar and percentage terms between February 14, 2020 and March 6, 2020. Globally, equity markets lost $7.3 trillion in value over this three-week period, and it is ironic that China, the starting point for the Corona Virus, is the only part of the world where stocks have collectively seen an increase in market capitalization. That can be explained perhaps by the fact that Chinese stocks had already registered drops in the weeks leading into February 14, and that the rest of the world is playing catch up. The last five columns look at the percentage change in individual stocks to illustrate how widely the pain was felt. In ten of the twelve regions, with China and Africa being the exceptions, less than 25% of stocks went up during the three week period. In most of the markets, the percentage change in overall market capitalization is similar to the percentage change in the median stock, indicating that this is not a decline being caused by a subset of stocks being hit with extreme price movements.
b. The Sector/Industry Breakdown
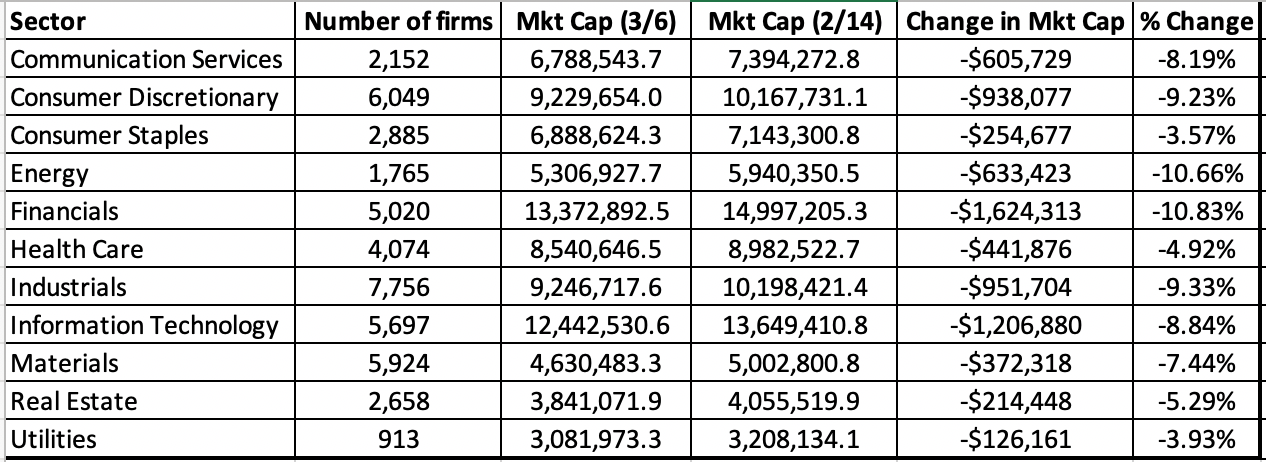
There is no question that the virus not only has the potential to hurt the global economy, but the hurt will be felt disproportionately by companies in different businesses. To assess how the market has repriced different sectors, I look at the market capitalization lost, in both dollar and percent terms, by sector, for global companies:
 |
| Download spreadsheet |
The biggest losers were energy and financial service companies, and the sectors that performed the best were utilities, health care, real estate and consumer staples. Breaking down the sectors into more detail, I looked at US stocks, by industry, and the following is the list of the five worst and five best performing industries between February 14 and March 6:
 |
| Download spreadsheet |
The full list is available for download by clicking here. For anyone who has been following the news stories of airlines scrambling to cancel flights and mollify passengers and hotels dealing with cancellations, it should come as no surprise that aviation and hotel stocks were the worst performing industry groupings, followed by oil, broadcasting and life insurance. The best performing industry grouping also carries no surprises, with precious metal companies benefiting from the rise in gold prices, grocery retailers and tobacco drawing on their strengths as non-discretionary products and biotech companies benefiting from the focus on a solution for the virus.


