Analysts track how many shares are being “shorted” in the market, and use that data to gauge sentiment. If shares shorted are increasing, short sellers are signaling they believe the shares are likely to drop. If shares shorted decrease, it means short sellers think shares will likely increase (great for average investors, bad for short sellers).
Opposite Signals
To create the list of stocks below we screened the universe of stocks on the US exchanges (with market caps above $50 million) for an INCREASE in shares shorted month-over-month. Again, this signals they think share price will fall.
But here’s the interesting part: All of these stocks have been slightly outperforming the market, as gauged by the S&P 500 index, over the past month. We call this a “winning streak”, measured by a persistence of days in which the stock outperformed the S&P 500 and little persistence of days in underperforming the index. We measured this by the ratio of the longest winning streak (in days) divided by the longest losing streak over the last month.
The List
So we’re left with a list of stocks that have been outperforming the market for 1 month, in the same period that short sellers have become pessimistic about their performance.
This likely means short sellers think this positive momentum won’t last, and that a price correction to the downside is likely.
Take a look at the list below and the relevant data. Do you agree with short sellers that their winning streaks are coming to an end? Use this as a starting point for your own analysis.
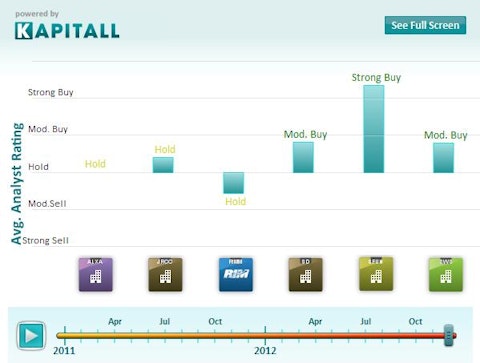
Compare changes in average analyst ratings over the past two years for the 6 stocks listed below:
1. Alexza Pharmaceuticals, Inc. (NASDAQ:ALXA) (Earnings, Analysts, Financials): Focuses on the research, development, and commercialization of novel proprietary products for the acute treatment of central nervous system conditions. Market cap at $89.59M, most recent closing price at $5.71. Shares shorted have increased from 2.18M to 2.42M over the last month, an increase which represents about 1.62% of the company’s float of 14.80M shares. Days to cover ratio at 3.73 days.
The stock’s average daily alpha vs. the S&P500 index stands at 1.84% (measured close to close, over the last month). During this period, the longest winning streak lasted 5 days (i.e. the stock’s daily returns outperformed the S&P 500 for 5 consecutive days). The longest losing streak lasted 2 days (i.e. a win streak / losing streak ratio of 2.5).
2. James River Coal Company (NASDAQ:JRCC) (Earnings, Analysts, Financials): Engages in mining, processing, and selling bituminous, steam, and industrial grade coal in eastern Kentucky and in southern Indiana. Market cap at $129.92M, most recent closing price at $3.62. Shares shorted have increased from 8.15M to 9.24M over the last month, an increase which represents about 3.18% of the company’s float of 34.28M shares. Days to cover ratio at 3.1 days.
The stock’s average daily alpha vs. the S&P500 index stands at 2.3% (measured close to close, over the last month). During this period, the longest winning streak lasted 6 days (i.e. the stock’s daily returns outperformed the S&P 500 for 6 consecutive days). The longest losing streak lasted 2 days (i.e. a win streak / losing streak ratio of 3.).
3. Research In Motion Limited (NASDAQ:RIMM) (Earnings, Analysts, Financials): Designs, manufactures, and markets wireless solutions for the worldwide mobile communications market. Market cap at $7.3B, most recent closing price at $13.93. Shares shorted have increased from 104.20M to 113.69M over the last month, an increase which represents about 1.95% of the company’s float of 486.37M shares. Days to cover ratio at 3.3 days.
The stock’s average daily alpha vs. the S&P500 index stands at 2.24% (measured close to close, over the last month). During this period, the longest winning streak lasted 6 days (i.e. the stock’s daily returns outperformed the S&P 500 for 6 consecutive days). The longest losing streak lasted 1 day (i.e. a win streak / losing streak ratio of 6.).
4. SandRidge Energy Inc. (NYSE:SD) (Earnings, Analysts, Financials): Operates as an independent natural gas and oil company in the United States. Market cap at $3.15B, most recent closing price at $6.42. Shares shorted have increased from 59.25M to 70.11M over the last month, an increase which represents about 3.53% of the company’s float of 307.42M shares. Days to cover ratio at 4.6 days.
The stock’s average daily alpha vs. the S&P500 index stands at 0.99% (measured close to close, over the last month). During this period, the longest winning streak lasted 7 days (i.e. the stock’s daily returns outperformed the S&P 500 for 7 consecutive days). The longest losing streak lasted 2 days (i.e. a win streak / losing streak ratio of 3.5).
5. SouFun Holdings Limited (NYSE:SFUN) (Earnings, Analysts, Financials): Provides marketing, listing, technology, and information consultancy services to real estate and home furnishing industries in the People’s Republic of China. Market cap at $424.55M, most recent closing price at $22.85. Shares shorted have increased from 2.45M to 2.77M over the last month, an increase which represents about 2.25% of the company’s float of 14.21M shares. Days to cover ratio at 11.67 days.
The stock’s average daily alpha vs. the S&P500 index stands at 1.1% (measured close to close, over the last month). During this period, the longest winning streak lasted 8 days (i.e. the stock’s daily returns outperformed the S&P 500 for 8 consecutive days). The longest losing streak lasted 3 days (i.e. a win streak / losing streak ratio of 2.67).
6. SWS Group, Inc. (NYSE:SWS) (Earnings, Analysts, Financials): Provides a range of investment and commercial banking, and related financial services to individual, corporate, and institutional investors, as well as broker/dealers, governmental entities, and financial intermediaries in the United States. Market cap at $169.99M, most recent closing price at $5.17. Shares shorted have increased from 589.37K to 910.31K over the last month, an increase which represents about 1.17% of the company’s float of 27.34M shares. Days to cover ratio at 6.62 days.
The stock’s average daily alpha vs. the S&P500 index stands at 0.97% (measured close to close, over the last month). During this period, the longest winning streak lasted 4 days (i.e. the stock’s daily returns outperformed the S&P 500 for 4 consecutive days). The longest losing streak lasted 1 day (i.e. a win streak / losing streak ratio of 4.).
This article was originally written by Rebecca Lipman, and posted on Kapitall.


