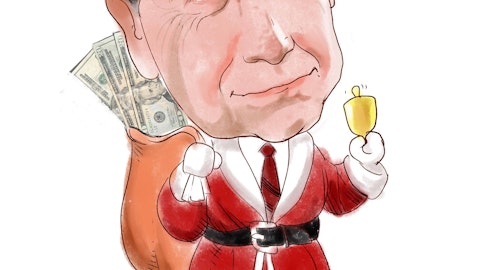
Ken Fisher stocks: Ken Fisher’s stock purchases and his portfolio overview originally published at long-term-investments.blogspot.com. I often look at the activities of the big players because some of them know what’s hot on the market. One investment guru I would like to introduce here today is Ken Fisher.
Fisher has assets of around $38 billion under management and he owns around 500 stocks of which 45 were completely new in his portfolio.
Because of the huge number of assets he own, the transaction list is very long and none of his deals had a really huge influence to his portfolio. The biggest move on the long side was the purchase of the UBS Fisher ETN “UBS Fisher Enhanced Big Cap Growth ETN”.
From his 20 biggest long transactions pay 12 a dividend.
Ken Fisher is one of the most diversified guy’s I’ve ever seen. The biggest portfolio position has a share of 2.7 percent and is reasonable to the Barclays ETN FI Enhanced Global High Yield ETN. Fisher owns 3 exchange traded funds in his top 20 positions with a total weighting of around 7.1 percent.
Beside ETFs, Fisher loves the Technology sector and bets on financial services stocks. All three categories represent around 47.4 percent of his assets.
Fisher reduced technology, energy and basic material stocks within the recent quarter. On the other side, he increased stocks from the financial services sector, healthcare and defensive consumer goods sector.

Here are the best yielding stock buys of Ken Fisher:
AbbVie Inc (NYSE:ABBV) has a market capitalization of $74.67 billion. The company employs 21,500 people, generates revenue of $18,380.00 million and has a net income of $5,275.00 million. AbbVie’s earnings before interest, taxes, depreciation and amortization (EBITDA) amounts to $7,614.00 million. The EBITDA margin is 41.43 percent (the operating margin is 31.65 percent and the net profit margin 28.70 percent).
Financial Analysis: The total debt represents 58.03 percent of AbbVie’s assets and the total debt in relation to the equity amounts to 466.01 percent. Due to the financial situation, a return on equity of 68.98 percent was realized by AbbVie. Twelve trailing months earnings per share reached a value of $3.25. Last fiscal year, AbbVie paid $1.60 in the form of dividends to shareholders. Ken Fisher increased the ABBV stake by 156.69 percent which had an impact to his portfolio of 0.07 percent.
Market Valuation: Here are the price ratios of the company: The P/E ratio is 14.48, the P/S ratio is 4.13 and the P/B ratio is finally 22.44. The dividend yield amounts to 3.34 percent and the beta ratio is not calculable.
Scotts Miracle-Gro Co (NYSE:SMG) has a market capitalization of $3.41 billion. The company employs 6,100 people, generates revenue of $2,826.10 million and has a net income of $113.20 million. Scotts Miracle-Gro’s earnings before interest, taxes, depreciation and amortization (EBITDA) amounts to $312.40 million. The EBITDA margin is 11.05 percent (the operating margin is 8.62 percent and the net profit margin 4.01 percent).
Financial Analysis: The total debt represents 37.73 percent of Scotts Miracle-Gro’s assets and the total debt in relation to the equity amounts to 130.02 percent. Due to the financial situation, a return on equity of 19.49 percent was realized by Scotts Miracle-Gro. Twelve trailing months earnings per share reached a value of $2.26. Last fiscal year, Scotts Miracle-Gro paid $1.22 in the form of dividends to shareholders. Ken Fisher increased the SMG stake by 35.57 percent which had an impact to his portfolio of 0.05 percent.
Market Valuation: Here are the price ratios of the company: The P/E ratio is 24.40, the P/S ratio is 1.21 and the P/B ratio is finally 5.64. The dividend yield amounts to 3.16 percent and the beta ratio has a value of 0.44.
Infosys Ltd ADR (NYSE:INFY) has a market capitalization of $27.69 billion. The company employs 157,263 people, generates revenue of $7,398.00 million and has a net income of $1,725.00 million. Infosys’s earnings before interest, taxes, depreciation and amortization (EBITDA) amounts to $2,116.00 million. The EBITDA margin is 28.60 percent (the operating margin is 25.80 percent and the net profit margin 23.32 percent).
Financial Analysis: The total debt represents 0.00 percent of Infosys’s assets and the total debt in relation to the equity amounts to 0.00 percent. Due to the financial situation, a return on equity of 24.81 percent was realized by Infosys. Twelve trailing months earnings per share reached a value of $3.02. Last fiscal year, Infosys paid $0.78 in the form of dividends to shareholders. Ken Fisher increased the INFY stake which had an impact to his portfolio of 0.08 percent.
Market Valuation: Here are the price ratios of the company: The P/E ratio is 16.03, the P/S ratio is 3.75 and the P/B ratio is finally 3.73. The dividend yield amounts to 1.54 percent and the beta ratio has a value of 1.15.
Prudential Financial Inc (NYSE:PRU) has a market capitalization of $48.42 billion. The company employs 25,414 people, generates revenue of $87,123.10 million and has a net income of $3,461.69 million. Prudential’s earnings before interest, taxes, depreciation and amortization (EBITDA) amounts to $14,282.06 million. The EBITDA margin is 16.39 percent (the operating margin is 4.80 percent and the net profit margin 3.97 percent).
Financial Analysis: The total debt represents 3.12 percent of Prudential’s assets and the total debt in relation to the equity amounts to 92.66 percent. Due to the financial situation, a return on equity of 22.86 percent was realized by Prudential. Twelve trailing months earnings per share reached a value of $2.06. Last fiscal year, Prudential paid $0.93 in the form of dividends to shareholders. Ken Fisher increased the PUK stake by 534.04 percent which had an impact to his portfolio of 0.1 percent.
Market Valuation: Here are the price ratios of the company: The P/E ratio is 18.37, the P/S ratio is 0.56 and the P/B ratio is finally 2.93. The dividend yield amounts to 2.44 percent and the beta ratio has a value of 1.89.
Take a closer look at the full list of Ken Fisher’s biggest dividend stock buys and his portfolio. The average P/E ratio amounts to 30.62 and forward P/E ratio is 19.93. The dividend yield has a value of 0.96 percent. Price to book ratio is 4.22 and price to sales ratio 2.75. The operating margin amounts to 22.34 percent and the beta ratio is 1.60. Stocks from the list have an average debt to equity ratio of 0.82.
*I have no positions in any stocks mentioned, and no plans to initiate any positions within the next 72 hours. I receive no compensation to write about any specific stock, sector or theme.
Check back here for more updates on Ken Fisher’s stock picks.
Recommended articles:
Ken Fisher’s Low-P/E Stock Picks
DIsclosure: none
