Henry Kissinger famously said: “Even a paranoid can have enemies.”
In the spirit of Kissinger’s pragmatic paranoia, when a stock with enormous long-term potential endures a setback in the market, it’s a good practice to dig into available data to test your investment assumptions. After all, even the best-run companies can be overpriced. Since Whole Foods Market, Inc. (NASDAQ:WFM) reported fiscal 2013 first-quarter earnings in mid-February, the stock has declined about 11.5% from its recent closing high of $96.90. Despite the haircut, the company still trades at a fairly rich 32.4 times trailing-12-month earnings. Traditional grocery competitors such as The Kroger Co. (NYSE:KR) and Safeway Inc. (NYSE:SWY) sell at more mundane valuations, with recent price-to-earnings ratios of 22.4 and 10.0, respectively. If you’ve accumulated Whole Foods Market, Inc. (NASDAQ:WFM) shares for the long term, you may want to ask yourself a pertinent question: Is its premium price relative to peers still justified?
![]()
Whole Foods Market’s, Inc. (NASDAQ:WFM) stock sell-off was triggered by investor disappointment that the company did not plan to raise earnings per share or revenue growth guidance for fiscal 2013. The reluctance to raise earnings guidance is attributable to a projected static or slightly lower gross margin for the remainder of the year. Whole Foods Market, Inc. (NASDAQ:WFM) is trying to increase its value proposition to customers by “investing in price.” This means that the company is increasingly willing to adjust its pricing to attract and maintain customers, along with experimenting with product mix and promotions.
Long-term, this is a logical strategy, as the company has lately battled a reputation as a high-priced food retailer. It’s also likely necessary, as the U.S. economy remains soft. Management pointed out in its earnings call on Feb. 13 that the third and fourth quarters of the prior year were record quarters for gross margin, setting up difficult comparisons for the rest of 2013 (Whole Foods’ fiscal year ends on Sept. 30). That noted, the company’s stellar gross margin is one of the reasons investors pay a higher multiple for Whole Foods’ earnings than its competitors. Whole Foods’ current 35% gross margin, for example, exceeds Kroger’s current gross margin by roughly 15 percentage points.
If healthy gross margins substantiate a company’s ability to price adequately and control variable costs, net profit margins are the ultimate indicator of the ability to deliver all-in earnings per share. On a quarterly basis, it’s rather seductive to focus on gross margin. But long-term investors should always pause and relate gross margin and net profit margin; you want these two stars to be in alignment. Below is a comparison of Whole Foods’ net profit margin with Kroger and Safeway, including a more comparable competitor, The Fresh Market Inc (NASDAQ:TFM) :
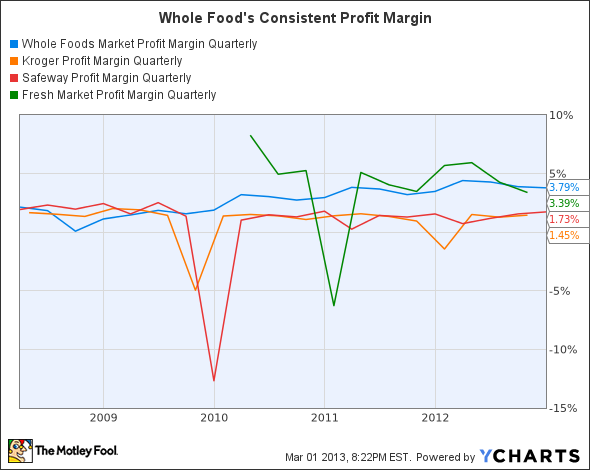
WFM Profit Margin Quarterly data by YCharts.
According to Yahoo! Finance, the average profit margin of the grocery sector is 0.7%. Part of Whole Foods’ stock price premium exists in this ability to deliver net profit margins at several multiples above the industry average. In the price-sensitive grocery industry, it might appear that at a profit margin of 3.79%, Whole Foods is nearing an upper limit on its bottom-line results. But as the company enjoys greater economies of scale as it grows, there may still be room to expand net margin another percentage point or so. Finally, note how consistent net margin is when compared not only to mainline competitors, but also to Whole Foods’ quite similar natural and organic foods peer The Fresh Market.


