Every investor can appreciate a stock that consistently beats the Street without getting ahead of its fundamentals and risking a meltdown. The best stocks offer sustainable market-beating gains, with improving financial metrics that support strong price growth. Let’s look at what Freeport-McMoRan Copper & Gold Inc. (NYSE:FCX)‘s recent results tell us about its potential for future gains.
What the numbers tell you
The graphs you’re about to see tell Freeport’s story, and we’ll be grading the quality of that story in several ways.
Growth is important on both top and bottom lines, and an improving profit margin is a great sign that a company’s become more efficient over time. Since profits may not always reported at a steady rate, we’ll also look at how much Freeport’s free cash flow has grown in comparison to its net income.
A company that generates more earnings per share over time, regardless of the number of shares outstanding, is heading in the right direction. If Freeport’s share price has kept pace with its earnings growth, that’s another good sign that its stock can move higher.
Is Freeport managing its resources well? A company’s return on equity should be improving, and its debt-to-equity ratio declining, if it’s to earn our approval.
Healthy dividends are always welcome, so we’ll also make sure that Freeport’s dividend payouts are increasing, but at a level that can be sustained by its free cash flow.
By the numbers
Now, let’s look at Freeport’s key statistics:

FCX Total Return Price data by YCharts.
| Passing Criteria | 3-Year* Change | Grade |
|---|---|---|
| Revenue growth > 30% | 19.8% | Fail |
| Improving profit margin | (21.8%) | Fail |
| Free cash flow growth > Net income growth | (90%) vs. 20.3% | Fail |
| Improving EPS | 8.5% | Pass |
| Stock growth (+ 15%) < EPS growth | (2.6%) vs. 8.5% | Pass |
Source: YCharts.
*Period begins at end of Q4 2009.
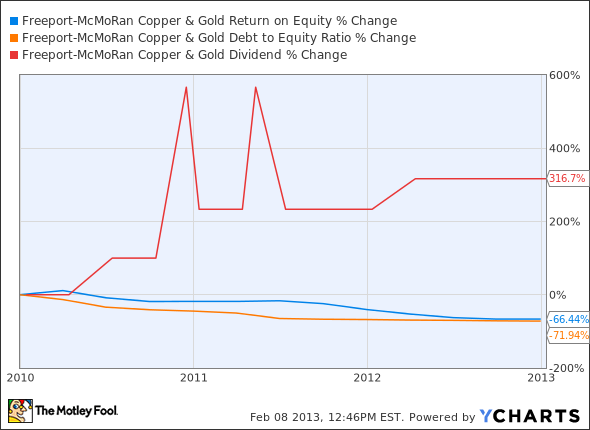
FCX Return on Equity data by YCharts.
| Passing Criteria | 3-Year* Change | Grade |
|---|---|---|
| Improving return on equity | (66.4%) | Fail |
| Declining debt to equity | (71.9%) | Pass |
| Dividend growth > 25% | 316.7% | Pass |
| Free cash flow payout ratio < 50% | 324.3% | Fail |
Source: YCharts and Morningstar.
*Period begins at end of Q4 2009.
How we got here and where we’re going
It hasn’t been a particularly good stretch for Freeport, which earns four out of nine passing grades despite a solid fourth-quarter earnings report late last month. Return on equity and free cash flow have both fallen precipitously, and the stock’s dividend may be in danger soon if Freeport can’t push that cash flow total higher. What will it take to earn Freeport a better grade next time?


