
TJX Cos.’s analysis versus peers uses the following peer-set: Target Corporation (NYSE:TGT), Macy’s, Inc. (NYSE:M), Ross Stores, Inc. (NASDAQ:ROST), TRUWORTHS INTL LTD (PINK:TRWKF), Dillard’s, Inc. (NYSE:DDS), SHIMAMURA Co., Ltd. (TYO:8227), Ascena Retail Group Inc (NASDAQ:ASNA) and Marisa Lojas S.A. (AMAR3). The table below shows the preliminary results along with the recent trend for revenues, net income and returns.
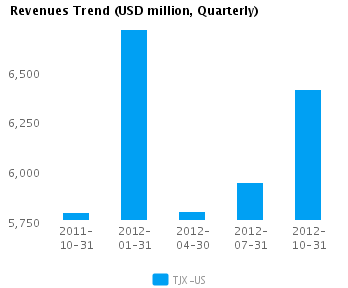
| Quarterly (USD million) | 2012-10-31 | 2012-07-31 | 2012-04-30 | 2012-01-31 | 2011-10-31 |
|---|---|---|---|---|---|
| Revenues | 6,410.9 | 5,945.6 | 5,798.1 | 6,709.8 | 5,793.1 |
| Revenue Growth % | 7.8 | 2.5 | (13.6) | 15.8 | 5.9 |
| Net Income | 461.6 | 421.1 | 419.2 | 475.3 | 406.5 |
| Net Income Growth % | 9.6 | 0.5 | (11.8) | 16.9 | 16.7 |
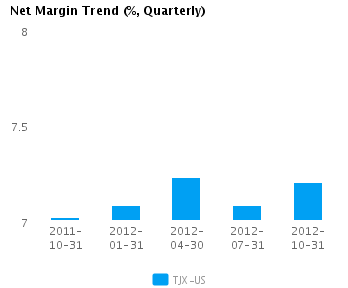
| Net Margin % | 7.2 | 7.1 | 7.2 | 7.1 | 7.0 |
| ROE % (Annualized) | 53.9 | 50.1 | 51.3 | 59.5 | 51.7 |
| ROA % (Annualized) | 20.7 | 19.7 | 20.0 | 22.6 | 19.6 |
Valuation Drivers
TJX Cos. currently trades at a higher Price/Book ratio (9.0) than its peer median (2.9). TJX-US achieved a better operating performance than the median of its chosen peers (ROE of 53.5% compared to the peer median ROE of 18.9%) and the market still expects faster growth from it than from those peers (PE of 18.1 compared to peer median of 14.4).
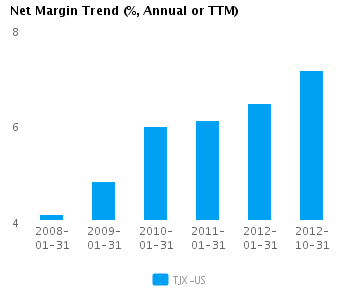
The company has a successful operating strategy with above median net profit margins of 7.1% (vs. peer median of 5.5%) and relatively high asset turns of 2.8x (vs. peer median of 1.4x). This suggests that the company has a dominant operating model relative to its peers. TJX-US’s net margin is its highest relative to the last five years and compares to a low of 4.1% in 2008.
Economic Moat
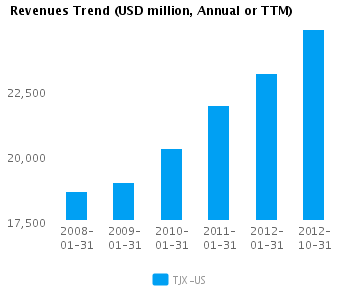
Growth in TJX-US’s revenues and earnings have been in-line with its chosen peers (annual revenue growth of 5.7% and earnings growth of 11.7% respectively). Its top-line performance seems to imply ‘more of the same’ for earnings. TJX-US is currently converting every 1% of change in revenue into 2.1% change in annual reported earnings.
TJX-US’s return on assets is above its peer median both in the current period (20.1% vs. peer median 7.4%) and also over the past five years (16.0% vs. peer median 8.0%). This performance suggests that the company’s relatively high operating returns are sustainable.
The company’s gross margin of 30.1% is around peer median suggesting that TJX-US’s operations do not benefit from any differentiating pricing advantage. However, TJX-US’s pre-tax margin is more than the peer median (11.5% compared to 8.3%) suggesting relatively tight control on operating costs.
Growth & Investment Strategy
While TJX-US’s revenues growth has been around the peer median in recent years (6.9% vs. 6.9% respectively for the past three years), the market gives its shares a higher than peer median PE ratio of 18.1. The market seems to see faster growth ahead.
TJX-US’s annualized rate of change in capital of 11.1% over the past three years is around the same as its peer median of 11.1%. This investment has generated a better than peer median return on capital of 36.7% averaged over the same three years. The greater than peer median rate of return suggest that the company may be under investing in growth.
Earnings Quality
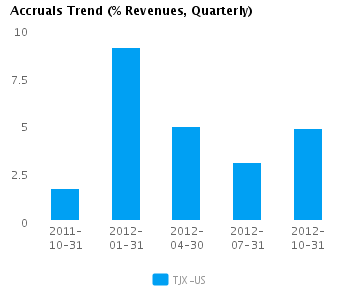
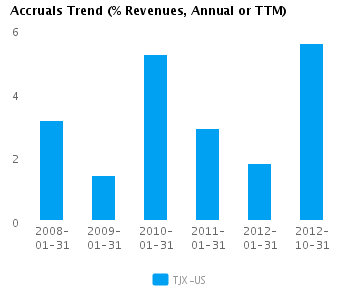
TJX-US has reported relatively strong net income margin for the last twelve months (7.1% vs. peer median of 5.5%). This margin performance combined with relatively high accruals (5.6% vs. peer median of 3.7%) suggests possible conservative accounting and an understatement of its reported net income.
TJX-US’s accruals over the last twelve months are positive suggesting a buildup of reserves. In addition, the level of accrual is greater than the peer median — which suggests a relatively strong buildup in reserves compared to its peers.
Trend Charts
Company Profile
Disclaimer
This article was originally written by abha.dawesar, and posted on CapitalCube.


