Earnings Analysis Stanley Black & Decker Inc. (NYSE:SWK)

Earnings Analysis Stanley Black & Decker Inc. (NYSE:SWK)Stanley Black & Decker, Inc. (NYSE:SWK) recently reported its preliminary financial results based on which we provide a unique peer-based analysis of the company. Our analysis is based on the company’s performance over the last twelve months (unless stated otherwise). For a more detailed analysis of this company (and over 40,000 other global equities) please visit www.capitalcube.com.

Stanley Black & Decker Inc.’s analysis versus peers uses the following peer-set: Makita Corporation (NASDAQ:MKTAY), Snap-on Incorporated (NYSE:SNA), Lincoln Electric Holdings, Inc. (NASDAQ:LECO), Kennametal Inc. (NYSE:KMT), Husqvarna AB (STO:HUSQ-B), The Toro Company (NYSE:TTC) and HIWIN TECH CORP TWD10 (TPE:2049). The table below shows the preliminary results along with the recent trend for revenues, net income and returns.
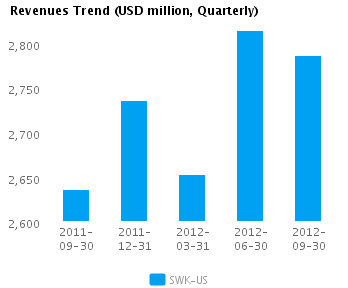
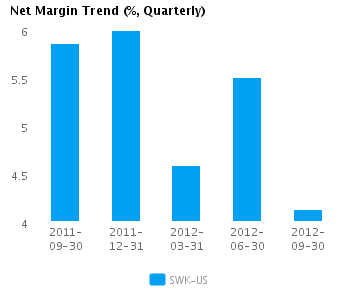
Quarterly (USD million) 2012-09-30 2012-06-30 2012-03-31 2011-12-31 2011-09-30
Revenues 2,786.7 2,814.2 2,652.9 2,736.1 2,636.4
Revenue Growth % (1.0) 6.1 (3.0) 3.8 0.5
Net Income 115.2 154.8 121.8 163.8 154.6
Net Income Growth % (25.6) 27.1 (25.6) 6.0 (21.6)
Net Margin % 4.1 5.5 4.6 6.0 5.9
ROE % (Annualized) 6.6 8.8 6.9 9.3 8.5
ROA % (Annualized) 2.8 3.8 3.0 4.0 3.8

Valuation Drivers

Stanley Black & Decker Inc.’s current Price/Book of 1.7 is about median in its peer group. The market expects SWK-US to grow faster than the median of its chosen peers (PE of 21.6 compared to peer median of 15.1) and to improve its current ROE of 7.8% which is below its peer median of 18.4%. Thus, the market seems to expect a turnaround in SWK-US’s current performance.

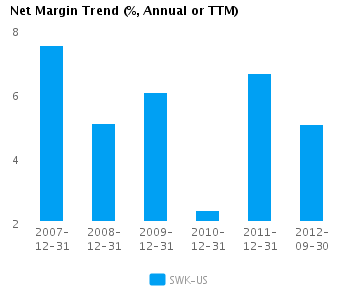
The company does not seem to have a viable operating strategy as is evident from low net profit margins (currently 5.1% vs. peer median of 9.1%) and poor asset turns (currently 0.7x compared to peer median of 0.9x). We classify this operating model as problematic relative to its peers. SWK-US’s net margin is similar to its five-year average net margin of 5.5%.

Economic Moat

The company enjoys both better than peer median annual revenue growth of 23.4% and better than peer median earnings growth performance 248.1%. SWK-US currently converts every 1% of change in annual revenue into 10.6% of change in annual reported earnings. We view this company as a leader among its peers.

SWK-US’s return on assets is less than its peer median currently (3.3% vs. peer median 9.5%). It has also had less than peer median returns on assets over the past five years (4.7% vs. peer median 7.8%). This performance suggests that the company has persistent operating challenges relative to peers.

The company’s gross margin of 39.9% is around peer median suggesting that SWK-US’s operations do not benefit from any differentiating pricing advantage. In addition, SWK-US’s pre-tax margin is less than the peer median (6.3% compared to 13.2%) suggesting relatively high operating costs.

Growth & Investment Strategy

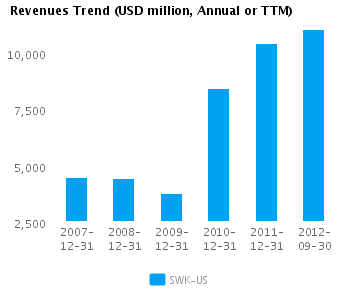
SWK-US has grown its revenues faster than its peers (32.8% vs. 5.7% respectively for the past three years). The market also sees relatively higher long-term growth prospects for the company, giving it a better than peer median PE ratio of 21.6. Overall, we classify the company’s growth prospects as superior relative to its peers.

SWK-US’s annualized rate of change in capital of 46.4% over the past three years is greater than the peer median of 9.4%. This relatively high investment has generated a less than peer median return on capital of 5.4% averaged over the same three years. The relatively high investment and low current returns lead us to believe that the company is betting heavily on the future.
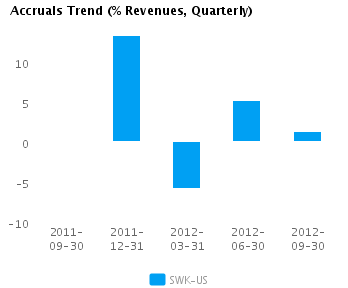
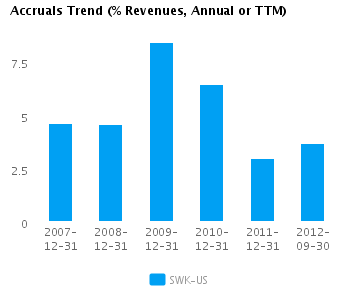
Earnings Quality

SWK-US reported relatively weak net income margins for the last twelve months (5.1% vs. peer median of 9.1%). This weak margin performance and relatively conservative accrual policy (3.7% vs. peer median of 0.1%) suggest the company might likely be understating its net income, possibly to the extent that there might even be some sandbagging of the reported net income numbers.
SWK-US’s accruals over the last twelve months are positive suggesting a buildup of reserves. In addition, the level of accrual is greater than the peer median — which suggests a relatively strong buildup in reserves compared to its peers.

Trend Charts

Graph of Revenues Trend for Stanley Black & Decker, Inc. (NYSE:SWK)
Graph of Net Margin Trend for Stanley Black & Decker, Inc. (NYSE:SWK)
Graph of Accruals Trend (% revenues, Quarterly) for Stanley Black & Decker, Inc. (NYSE:SWK)
Graph of Accruals Trend (% revenues, Annual or TTM) for Stanley Black & Decker, Inc. (NYSE:SWK)

Company Profile

Stanley Black & Decker, Inc. provides power, hand tools and mechanical access solutions such as automatic doors, commercial and residential locking systems, electronic security and monitoring systems. It also manufactures and markets industrial tools and security solutions. The company operates through three segments: Construction & Do-It-Yourself, Security and Industrial. The Construction & Do-It-Yourself segment comprises of the professional power tool and accessories business, the consumer power tool business, which includes outdoor products, plumbing (Pfister) and the hand tools, fasteners & storage business. The professional power tool and accessories business sells professional grade corded and cordless electric power tools and equipment including drills, impact wrenches and drivers, grinders, saws, routers and sanders. The consumer power tool business sells corded and cordless power tools sold under the Black & Decker brand, lawn and garden products and home products. Lawn and garden products include hedge trimmers, string trimmers, lawn mowers, edgers, and related accessories. Home products include hand held vacuums, paint tools and cleaning appliances. The hand tools, fasteners & storage business sells measuring and leveling tools, planes, hammers, demolition tools, knives, saws and chisels. Fastening products include pneumatic tools and fasteners including nail guns, nails, staplers and staples. Storage products include tool boxes, sawhorses and storage units. The security segment comprises of the electronic security solutions and the mechanical access solutions businesses. The electronic security solutions business designs, supplies and installs electronic security systems and provides electronic security services, including alarm monitoring, video surveillance, fire alarm monitoring, systems integration and system maintenance. The mechanical access solutions business sells and installs automatic doors, residential and commercial hardware, locking mechanisms, electronic keyless entry systems, keying systems, tubular and mortise door locksets. The Industrial segment comprises of industrial and automotive repair tools, engineered fastening and infrastructure businesses. The industrial and automotive repair business sells hand tools, power tools, and engineered storage solution products. The engineered fastening business primarily sells engineered fasteners designed for specific applications. Stanley Black & Decker was founded by Frederick T. Stanley in 1843 and is headquartered in New Britain, CT.

Disclaimer

The information presented in this report has been obtained from sources deemed to be reliable, but AnalytixInsight does not make any representation about the accuracy, completeness, or timeliness of this information. This report was produced by AnalytixInsight for informational purposes only and nothing contained herein should be construed as an offer to buy or sell or as a solicitation of an offer to buy or sell any security or derivative instrument. This report is current only as of the date that it was published and the opinions, estimates, ratings and other information may change without notice or publication. Past performance is no guarantee of future results. Prior to making an investment or other financial decision, please consult with your financial, legal and tax advisors. AnalytixInsight shall not be liable for any party’s use of this report. AnalytixInsight is not a broker-dealer and does not buy, sell, maintain a position, or make a market in any security referred to herein. One of the principal tenets for us at AnalytixInsight is that the best person to handle your finances is you. By your use of our services or by reading any our reports, you’re agreeing that you bear responsibility for your own investment research and investment decisions. You also agree that AnalytixInsight, its directors, its employees, and its agents will not be liable for any investment decision made or action taken by you and others based on news, information, opinion, or any other material generated by us and/or published through our services. For a complete copy of our disclaimer, please visit our website www.analytixinsight.com.

This article was originally written by abha.dawesar, and posted on CapitalCube.