
Siemens AG ADS’s analysis versus peers uses the following peer-set: General Electric Company (NYSE:GE), 3M Co (NYSE:MMM), ABB Ltd (NYSE:ABB), Koninklijke Philips Electronics NV (NYSE:PHG), Hitachi, Ltd. (PINK:HTHIY), Motorola Solutions Inc (NYSE:MSI) and Nokia Corporation (NYSE:NOK). The table below shows the preliminary results along with the recent trend for revenues, net income and returns.
| Annual (USD million) | 2012-09-30 | 2011-09-30 | 2010-09-30 | 2009-09-30 | 2008-09-30 |
|---|---|---|---|---|---|
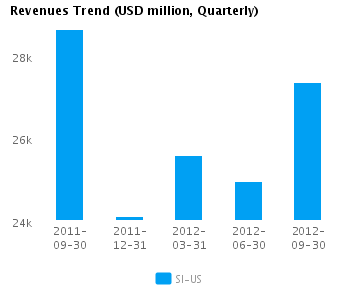
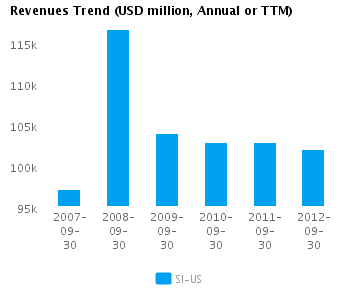
| Revenues | 101,949.2 | 102,884.2 | 102,822.5 | 103,887.4 | 116,528.7 |
| Revenue Growth % | (0.9) | 0.1 | (1.0) | (10.8) | 20.0 |
| Net Income | 6,579.5 | 9,565.6 | 5,336.1 | 3,052.2 | 2,558.8 |
| Net Income Growth % | (31.2) | 79.3 | 74.8 | 19.3 | (48.6) |
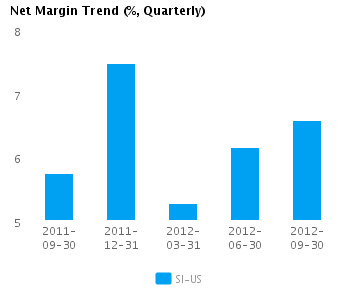
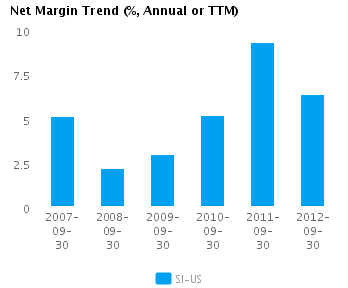
| Net Margin % | 6.5 | 9.3 | 5.2 | 2.9 | 2.2 |
| ROE % | 16.1 | 23.6 | 13.7 | 8.0 | 6.5 |
| ROA % | 4.6 | 6.7 | 3.8 | 2.2 | 1.9 |
Valuation Drivers
Siemens AG ADS currently trades at a higher Price/Book ratio (2.2) than its peer median (1.6). The market expects SI-US to grow at about the same rate as its chosen peers (PE of 15.2 compared to peer median of 15.2) and to maintain the peer median return (ROE of 15.8%) it currently generates.
The company’s asset efficiency (asset turns of 0.7x) and net profit margins of 6.4% are both median for its peer group. SI-US’s net margin has declined 2.9 percentage points from last year’s high but remains above its five-year average net margin of 4.9.
Economic Moat
The company has achieved better revenues growth than its chosen peers (year-on-year change in revenues of -0.9%) but its earnings growth performance has been below the median (change in annual reported earnings of -31.2% compared to the peer median of 8.2%). This suggests that, compared to its peers, the company is focused more on top-line revenues. SI-US is currently converting every 1% of change in revenue into 34.3% change in annual reported earnings.
SI-US’s return on assets currently is around peer median (4.6% vs. peer median 4.0%) — similar to its returns over the past five years (3.9% vs. peer median 3.4%). This performance suggests that the company has no specific competitive advantages relative to its peers.
The company’s gross margin of 31.8% is around peer median suggesting that SI-US’s operations do not benefit from any differentiating pricing advantage. In addition, SI-US’s pre-tax margin of 9.5% is also around the peer median suggesting no operating cost advantage relative to peers.
Growth & Investment Strategy
While SI-US’s revenues have grown faster than the peer median (-0.6% vs. -3.6% respectively for the past three years), the market gives the stock an about peer median PE ratio of 15.2. This suggests that the market has some questions about the company’s long-term strategy.
SI-US’s annualized rate of change in capital of -0.7% over the past three years is higher than its peer median of -2.0%. This investment has generated an above peer median return on capital of 10.8% averaged over the same three years. Evidently, the relatively high capital investment was successful given the the relatively strong growth in its returns.
Earnings Quality
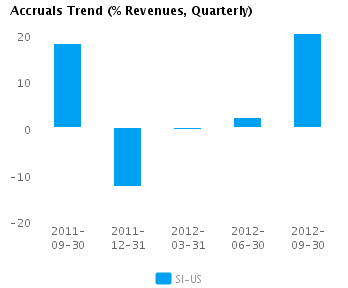
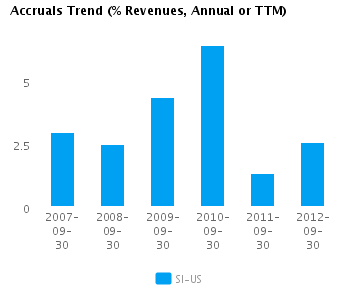
SI-US’s net income margin for the last twelve months is around the peer median (6.4% vs. peer median of 6.9%). This average margin combined with a level of accruals that is around peer median (2.5% vs. peer median of 2.8%) suggests there possibly isn’t too much accrual movement flowing into the company’s reported earnings.
SI-US’s accruals over the last twelve months are positive suggesting a buildup of reserves. However, this level of accruals is also around the peer median and suggests the company is recording a proper level of reserves compared to its peers.
Trend Charts
Company Profile
Disclaimer
This article was originally written by abha.dawesar, and posted on CapitalCube.


