Hess Corp.’s analysis versus peers uses the following peer-set: Exxon Mobil Corporation (NYSE:XOM), Chevron Corporation (NYSE:CVX), BP plc (NYSE:BP), Royal Dutch Shell plc (NYSE:RDS.B), TOTAL S.A. (NYSE:TOT), ConocoPhillips (NYSE:COP), Occidental Petroleum Corporation (NYSE:OXY), Repsol SA (PINK:REPYY), Marathon Oil Corporation (NYSE:MRO) and China Petroleum & Chemical Corp. (NYSE:SNP). The table below shows the preliminary results along with the recent trend for revenues, net income and returns.
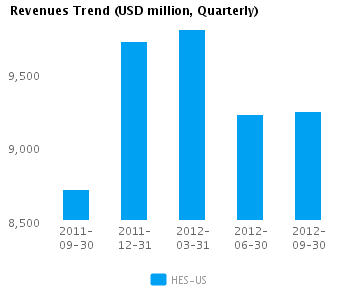
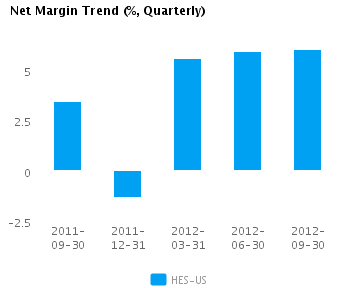
| Quarterly (USD million) | 2012-09-30 | 2012-06-30 | 2012-03-31 | 2011-12-31 | 2011-09-30 |
|---|---|---|---|---|---|
| Revenues | 9,243.0 | 9,224.0 | 9,801.0 | 9,719.0 | 8,715.0 |
| Revenue Growth % | 0.2 | (5.9) | 0.8 | 11.5 | (12.2) |
| Net Income | 557.0 | 549.0 | 545.0 | (131.0) | 298.0 |
| Net Income Growth % | 1.5 | 0.7 | N/A | (144.0) | (50.9) |
| Net Margin % | 6.0 | 6.0 | 5.6 | (1.3) | 3.4 |
| ROE % (Annualized) | 11.0 | 11.3 | 11.6 | (2.8) | 6.3 |
| ROA % (Annualized) | 5.4 | 5.4 | 5.5 | (1.4) | 3.2 |
Valuation Drivers
Hess Corp. trades at a lower Price/Book multiple (0.9) than its peer median (1.4). The market expects HES-US to grow faster than the median of its chosen peers (PE of 11.8 compared to peer median of 9.5) and to improve its current ROE of 7.7% which is below its peer median of 15.3%. Thus, the market seems to expect a turnaround in HES-US’s current performance.
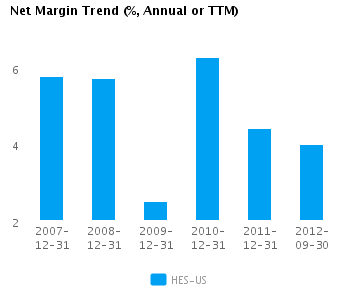
The company’s profit margins are below peer median (currently 4.0% vs. peer median of 5.9%) while its asset efficiency is about median (asset turns of 1.0x compared to peer median of 1.1x). HES-US’s net margin continues to trend downward and is below (but within one standard deviation of) its five-year average net margin of 4.9%.
Economic Moat
Changes in the company’s annual top line and earnings (13.5% and -19.9% respectively) generally lag its peers. This implies a lack of strategic focus and/or inability to execute. We view such companies as laggards relative to peers.
HES-US’s return on assets is now less than its peer median (3.8% vs. peer median 6.4%) in contrast to its returns over the past five years which were around the peer median (6.0% vs. peer median 6.9%). Recent performance suggests that the company’s historical competitive advantage is slipping away.
The company’s gross margin of 23.2% is around peer median suggesting that HES-US’s operations do not benefit from any differentiating pricing advantage. In addition, HES-US’s pre-tax margin is less than the peer median (10.0% compared to 12.9%) suggesting relatively high operating costs.
Growth & Investment Strategy
While HES-US’s revenues have increased more slowly than the peer median (-2.2% vs. -0.2% respectively for the past three years), the market currently gives the company a higher than peer median PE ratio of 11.8. The stock price may be factoring in some sort of a strategic play.
HES-US’s annualized rate of change in capital of 14.8% over the past three years is greater than the peer median of 11.2%. This relatively high investment has generated a less than peer median return on capital of 7.4% averaged over the same three years. The relatively high investment and low current returns lead us to believe that the company is betting heavily on the future.
Earnings Quality
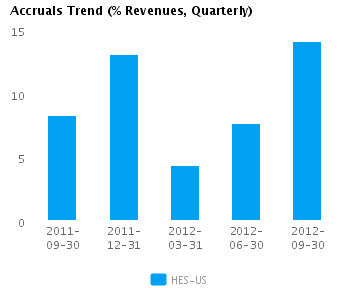
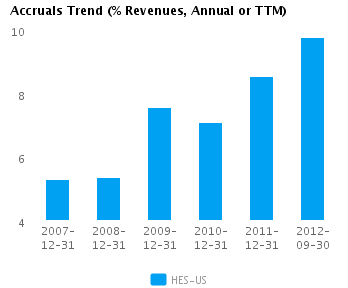
HES-US reported relatively weak net income margins for the last twelve months (4.0% vs. peer median of 5.9%). This weak margin performance and relatively conservative accrual policy (9.8% vs. peer median of 3.8%) suggest the company might likely be understating its net income, possibly to the extent that there might even be some sandbagging of the reported net income numbers.
HES-US’s accruals over the last twelve months are positive suggesting a buildup of reserves. In addition, the level of accrual is greater than the peer median — which suggests a relatively strong buildup in reserves compared to its peers.
Trend Charts