General Dynamics Corporation (NYSE:GD) recently reported its preliminary financial results based on which we provide a unique peer-based analysis of the company. Our analysis is based on the company’s performance over the last twelve months (unless stated otherwise). For a more detailed analysis of this company (and over 40,000 other global equities) please visit www.capitalcube.com.

General Dynamics Corp.’s analysis versus peers uses the following peer-set: The Boeing Company (NYSE:BA), Lockheed Martin Corporation (NYSE:LMT), EADS NV (EPA:EAD), Raytheon Company (NYSE:RTN), BAE SYSTEMS PLC ORD (PINK:BAESF), Northrop Grumman Corporation (NYSE:NOC), Dassault Aviation SA (EPA:AM) and Rockwell Collins, Inc. (NYSE:COL). The table below shows the preliminary results along with the recent trend for revenues, net income and returns. Earlier today we published our Earnings Analysis for Lockheed Martin Corp. (LMT) based on the latest data,
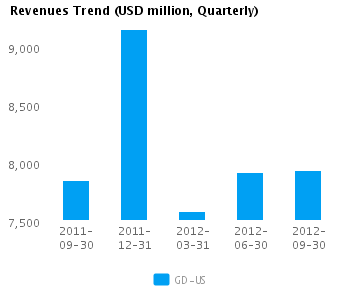
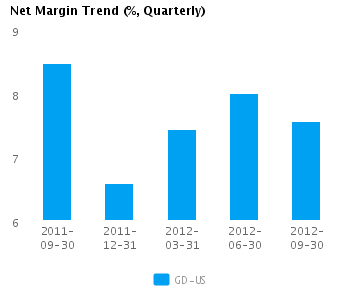
| Quarterly (USD million) | 2012-09-30 | 2012-06-30 | 2012-03-31 | 2011-12-31 | 2011-09-30 |
|---|---|---|---|---|---|
| Revenues | 7,934.0 | 7,922.0 | 7,579.0 | 9,147.0 | 7,853.0 |
| Revenue Growth % | 0.2 | 4.5 | (17.1) | 16.5 | (0.3) |
| Net Income | 600.0 | 634.0 | 564.0 | 603.0 | 665.0 |
| Net Income Growth % | (5.4) | 12.4 | (6.5) | (9.3) | (0.2) |
| Net Margin % | 7.6 | 8.0 | 7.4 | 6.6 | 8.5 |
| ROE % (Annualized) | 17.2 | 18.4 | 16.7 | 18.0 | 19.3 |
| ROA % (Annualized) | 6.8 | 7.2 | 6.4 | 7.1 | 8.0 |
Valuation Drivers
General Dynamics Corp. trades at a lower Price/Book multiple (1.6) than its peer median (4.4). The market expects GD-US to grow at about the same rate as its chosen peers (PE of 9.7 compared to peer median of 10.5) and to maintain the peer median return (ROE of 17.2%) it currently generates.
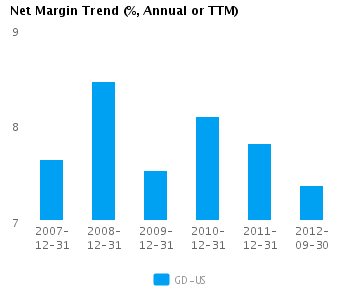
The company’s asset efficiency (asset turns of 0.9x) and net profit margins of 7.4% are both median for its peer group. GD-US’s net margin is its lowest relative to the last five years and compares to a high of 8.5% in 2008.
Economic Moat
GD-US’s revenues have changed in-line with its peers (year-on-year change in revenues is 0.6%) but its earnings have lagged (annual reported earnings have changed by -2.9% compared to the peer median of 9.6%), implying that the company has less control over its costs relative to its peers. GD-US is currently converting every 1% of change in revenue into -4.4% change in annual reported earnings.
GD-US’s current return on assets is around peer median (7.0% vs. peer median 7.0%). This contrasts with its higher than peer median return on assets over the past five years (8.3% vs. peer median 5.0%), suggesting that the company’s relative operating performance has declined.
The company’s comparatively low gross margins of 17.6% versus peer median of 23.7% suggests that it has a non-differentiated strategy or is in a pricing constrained position. However, GD-US’s pre-tax margin of 10.8% is around the peer median which, when combined with the gross margin, suggests lower operating costs relative to peers.
Growth & Investment Strategy
While GD-US’s revenues have grown faster than the peer median (3.7% vs. 2.4% respectively for the past three years), the market gives the stock an about peer median PE ratio of 9.7. This suggests that the market has some questions about the company’s long-term strategy.
GD-US’s annualized rate of change in capital of 6.8% over the past three years is greater than the peer median of 3.8%. However, this investment level has only generated a peer median return on capital of 15.7% averaged over the same three years. This median return on an above median capital investment suggests the company is overinvesting.
Earnings Quality
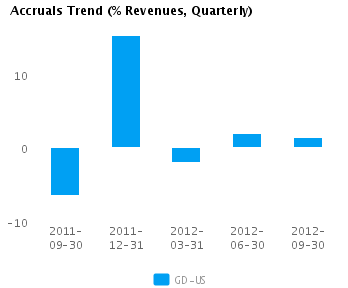
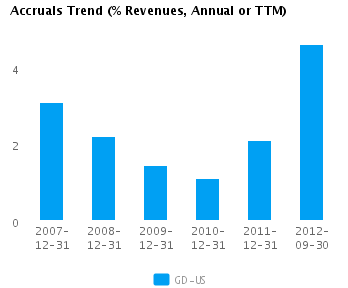
GD-US’s net income margin for the last twelve months is around the peer median (7.4% vs. peer median of 7.4%). This average margin and relatively conservative accrual policy (4.6% vs. peer median of 2.5%) suggests possible understatement of its reported net income.
GD-US’s accruals over the last twelve months are positive suggesting a buildup of reserves. In addition, the level of accrual is greater than the peer median — which suggests a relatively strong buildup in reserves compared to its peers.
Trend Charts
Company Profile
Disclaimer
This article was originally written by abha.dawesar, and posted on CapitalCube.


