Earnings Analysis: Textron Inc. (NYSE:TXT)

Earnings Analysis: Textron Inc. (NYSE:TXT)Textron Inc. (NYSE:TXT) recently reported its preliminary financial results based on which we provide a unique peer-based analysis of the company. Our analysis is based on the company’s performance over the last twelve months (unless stated otherwise). For a more detailed analysis of this company (and over 40,000 other global equities) please visit www.capitalcube.com.

Textron Inc.’s analysis versus peers uses the following peer-set: The Boeing Company (NYSE:BA), Lockheed Martin Corporation (NYSE:LMT), EADS NV (EPA:EAD), General Dynamics Corporation (NYSE:GD), BAE SYSTEMS PLC ORD (PINK:BAESF), Dassault Aviation SA (EPA:AM), Bombardier, Inc. (TSE:BBD.B), Embraer S.A. (EMBR3), Finmeccanica SpA (BIT:FNC) and Korea Aerospace Industries Ltd.(047810). The table below shows the preliminary results along with the recent trend for revenues, net income and returns.
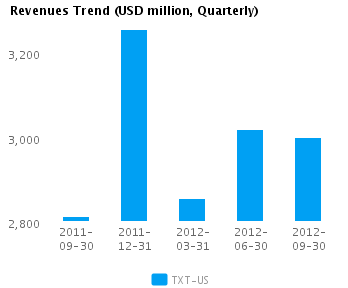
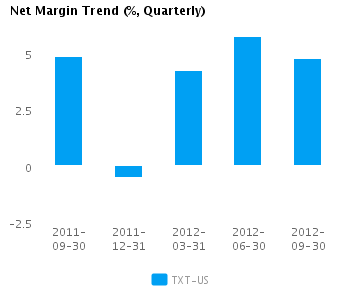
Quarterly (USD million) 2012-09-30 2012-06-30 2012-03-31 2011-12-31 2011-09-30
Revenues 3,000.0 3,019.0 2,856.0 3,254.0 2,814.0
Revenue Growth % (0.6) 5.7 (12.2) 15.6 3.2
Net Income 142.0 173.0 120.0 (17.0) 136.0
Net Income Growth % (17.9) 44.2 N/A (112.5) 47.8
Net Margin % 4.7 5.7 4.2 (0.5) 4.8
ROE % (Annualized) 17.7 23.0 17.0 (2.2) 16.8
ROA % (Annualized) 4.3 5.3 3.6 (0.5) 3.6

Valuation Drivers

Textron Inc.’s current Price/Book of 2.2 is about median in its peer group. The market expects TXT-US to grow faster than the median of its chosen peers (PE of 18.8 compared to peer median of 13.5) and to improve its current ROE of 12.6% which is below its peer median of 16.1%. Thus, the market seems to expect a turnaround in TXT-US’s current performance.

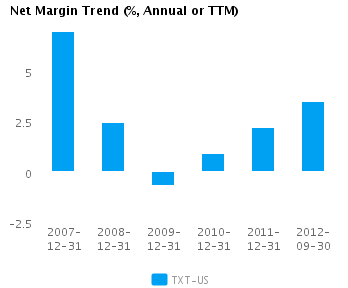
The company’s profit margins are below peer median (currently 3.4% vs. peer median of 5.7%) while its asset efficiency is about median (asset turns of 0.9x compared to peer median of 0.8x). TXT-US’s net margin continues to trend upward and is above (but within one standard deviation of) its five-year average net margin of 2.3%.

Economic Moat

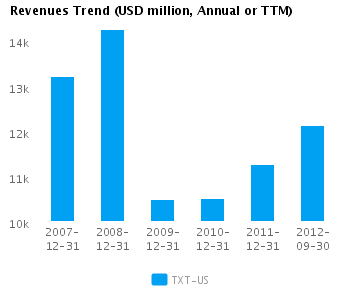
The company enjoys both better than peer median annual revenue growth of 7.1% and better than peer median earnings growth performance 163.0%. TXT-US currently converts every 1% of change in annual revenue into 22.9% of change in annual reported earnings. We view this company as a leader among its peers.

TXT-US’s return on assets is less than its peer median currently (2.9% vs. peer median 4.2%). It has also had less than peer median returns on assets over the past five years (1.7% vs. peer median 3.2%). This performance suggests that the company has persistent operating challenges relative to peers.

The company’s gross margin of 19.3% is around peer median suggesting that TXT-US’s operations do not benefit from any differentiating pricing advantage. In addition, TXT-US’s pre-tax margin is less than the peer median (5.0% compared to 7.7%) suggesting relatively high operating costs.

Growth & Investment Strategy

While TXT-US’s revenues have increased more slowly than the peer median (-7.5% vs. 2.9% respectively for the past three years), the market currently gives the company a higher than peer median PE ratio of 18.8. The stock price may be factoring in some sort of a strategic play.

TXT-US’s annualized rate of change in capital of -14.6% over the past three years is less than its peer median of -3.5%. This below median investment level has also generated a less than peer median return on capital of 1.1% averaged over the same three years. This outcome suggests that the company has invested capital relatively poorly and now may be in maintenance mode.

Earnings Quality

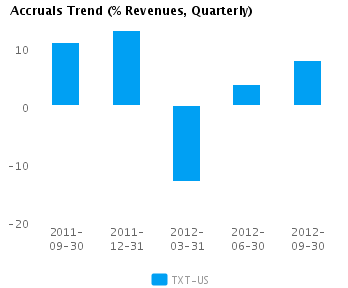
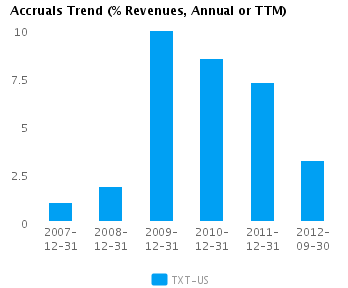
TXT-US reported relatively weak net income margins for the last twelve months (3.4% vs. peer median of 5.7%). This weak margin performance and relatively conservative accrual policy (3.2% vs. peer median of 1.5%) suggest the company might likely be understating its net income, possibly to the extent that there might even be some sandbagging of the reported net income numbers.

TXT-US’s accruals over the last twelve months are positive suggesting a buildup of reserves. In addition, the level of accrual is greater than the peer median — which suggests a relatively strong buildup in reserves compared to its peers.

Trend Charts

Graph of Revenues Trend for Textron Inc. (NYSE:TXT)
Graph of Net Margin Trend for Textron Inc. (NYSE:TXT)
Graph of Accruals Trend (% revenues, Quarterly) for Textron Inc. (NYSE:TXT)
Graph of Accruals Trend (% revenues, Annual or TTM) for Textron Inc. (NYSE:TXT)

Company Profile

Textron, Inc. manufactures aircrafts, automotive engines, industrial products, and military equipment. It operates in the aircraft, defense, industrial, and finance businesses worldwide. The company operates through five reportable business segments: Cessna, Bell, Textron Systems, Industrial and Finance. The Cessna Segment is the general aviation company based on unit sales with two principal lines of business: aircraft sales and aftermarket services. Aircraft sales include citation jets, caravan single-engine utility turboprops, single-engine piston aircraft and lift solutions by CitationAir. Aftermarket services include parts, maintenance, inspection and repair services. The Bell Segment is suppliers of military and commercial helicopters, tiltrotor aircraft, and related spare parts and services in the world. Bell supplies advanced military helicopters and support to the U.S. Government and to military customers outside the United States. The Textron Systems Segment product lines consist of unmanned aircraft systems, land and marine systems, weapons and sensors and a variety of defense and aviation mission support products and services. Textron Systems is a supplier to the defense, aerospace, homeland security and general aviation markets. It also sells products to customers outside the U.S. through foreign military sales sponsored by the U.S. Government and directly through commercial sales channels. The Industrial Segment designs and manufactures a variety of products under three principal product lines, which includes Golf and Turf Care product, Jacobsen and Greenlee business; Golf and Turf Care product line includes the products manufactured by Its E-Z-GO and Jacobsen business units. E-Z-GO designs, manufactures and sells golf cars and off-road utility vehicles powered by electric and internal combustion engines and electric on-road low speed vehicles under the E-Z-GO and cushman brand names, as well as multipurpose utility vehicles and off-road vehicles under the E-Z-GO, Cushman and Bad Boy Buggies brand names. Jacobsen designs, manufactures and sells professional turf-maintenance equipment, as well as specialized turf-care vehicles. Brand names include Ransomes, Jacobsen and Cushman. Jacobsen’s customers include golf courses, resort communities, sporting venues and municipalities. Greenlee designs and manufactures powered equipment, electrical test and measurement instruments, hand and hydraulic powered tools, and electrical and fiber optic assemblies under the Greenlee, Klauke, Paladin Tools and Tempo brand names. The Finance Segment is a commercial finance business that consists of Textron Financial Corp. and its consolidated subsidiaries, along with three other finance subsidiaries owned by Textron. It continues to originate new customer relationships and finance receivables in the captive finance business, which provides financing primarily for new Cessna aircraft and Bell helicopters and, to a limited extent, for new E-Z-GO and Jacobsen golf and turf-care equipment. It also provides financing to purchasers of pre-owned Cessna aircraft and Bell helicopters on a limited basis. The company was founded in 1923 by Royal Little and is headquartered in Providence, RI.

Disclaimer

The information presented in this report has been obtained from sources deemed to be reliable, but AnalytixInsight does not make any representation about the accuracy, completeness, or timeliness of this information. This report was produced by AnalytixInsight for informational purposes only and nothing contained herein should be construed as an offer to buy or sell or as a solicitation of an offer to buy or sell any security or derivative instrument. This report is current only as of the date that it was published and the opinions, estimates, ratings and other information may change without notice or publication. Past performance is no guarantee of future results. Prior to making an investment or other financial decision, please consult with your financial, legal and tax advisors. AnalytixInsight shall not be liable for any party’s use of this report. AnalytixInsight is not a broker-dealer and does not buy, sell, maintain a position, or make a market in any security referred to herein. One of the principal tenets for us at AnalytixInsight is that the best person to handle your finances is you. By your use of our services or by reading any our reports, you’re agreeing that you bear responsibility for your own investment research and investment decisions. You also agree that AnalytixInsight, its directors, its employees, and its agents will not be liable for any investment decision made or action taken by you and others based on news, information, opinion, or any other material generated by us and/or published through our services. For a complete copy of our disclaimer, please visit our website www.analytixinsight.com.

This article was originally written by abha.dawesar, and posted on CapitalCube.