We continue our week’s 360° look at American Express Company (NYSE:AXP) today with an assessment of its Dividend Quality. CapitalCube scores American Express Company (NYSE:AXP) Dividend Quality at 67; this score captures the quality, trend and coverage of the company’s dividend. More on how we arrive at this score here. You can also read our posts earlier this week on AXP’s Fundamental Analysis and Corporate Actions.
Today we assess the dividend quality of American Express Company (NYSE:AXP) stock and compare it to its peers in the Financial Conglomerates sector. These peers are: JPMorgan Chase & Co. (NYSE:JPM), Visa Inc (NYSE:V), Citigroup Inc. (NYSE:C), Bank of America Corp (NYSE:BAC), Mastercard Inc (NYSE:MA), Capital One Financial Corp. (NYSE:COF), Discover Financial Services (NYSE:DFS), and Cielo S/A (CIEL3).
 Dividend Score")
Dividend Quality

Medium Quality
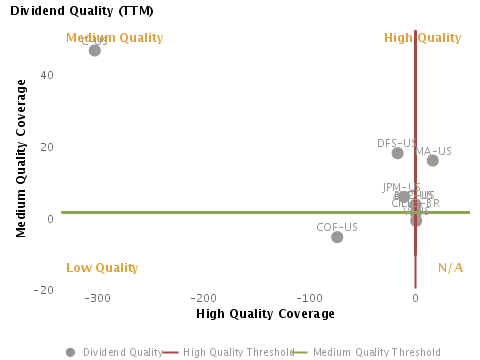
Over the last twelve months (prior to 2012-06-30), AXP-US paid a medium quality dividend, which represents a yield of 1.3% at the current price.
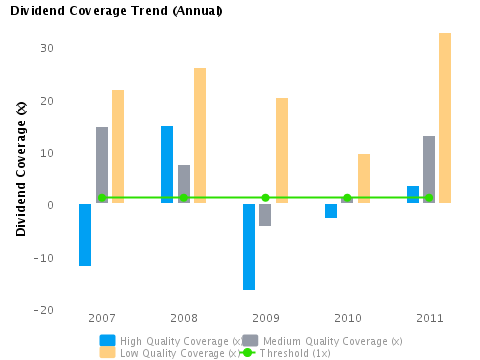
Dividend Quality Trend
Dividend quality trend has not been consistent over the last five years. Dividends were paid during each of these years — of these 2 were high quality, 2 were medium quality and 1 was low quality.
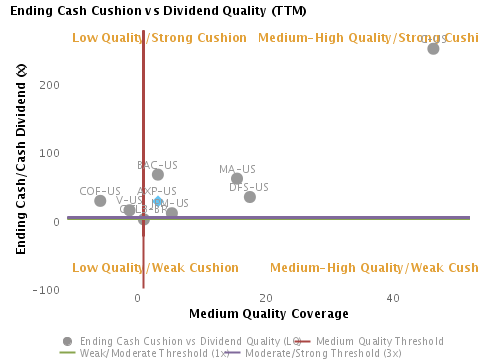
Dividend Coverage

Strong
The ending cash balance, with a dividend coverage of 26.5x, provides a substantial cushion in case of a significant reduction of cash flows in the future.
Dividend Quality
Cash flow coverage of the dividend paid is more relevant than dividend payout.
While traditional dividend analysis focuses on dividend payout from net income, we focus on the cash flow coverage of dividends (paid to the common stock) in order to determine their quality and sustainability. We assess whether dividends are being paid from operating, investing and issuance cash flows or whether the beginning cash balance is needed to make this payment. We make the assumption that cash dividends are paid only after net debt repayments. We consider the cash outflow from share buybacks to be discretionary and thus ignore its impact on cash required to support the dividend policy.
Dividends that are fully covered from operating and investing cash flow net of any cash outflow from debt repayments and net of a decrease in deposits (for banks) are considered to be “high quality”. Those that require an additional net cash inflow from issuance are categorized as “medium quality”. If operating, investing and issuance cash flows are not sufficient to fund the dividend and the beginning cash balance is used, the dividend is referred to as “low quality”.
This last category is most at risk of a dividend cut though we recognize that companies that have a large cash balance could continue to pay dividends even with a “low quality” dividend profile. For all these definitions, we assume the cash outlay for share buybacks is discretionary and can instead be used to support dividends.
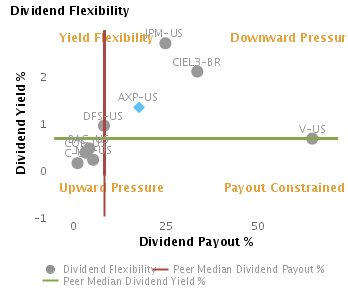
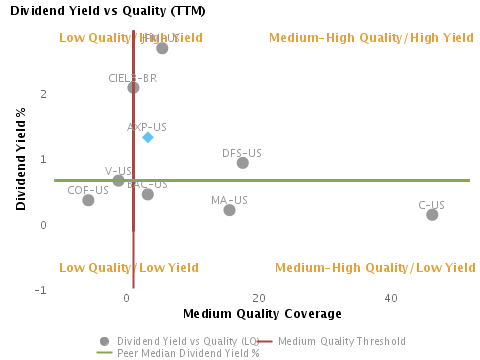
AXP-US’s dividend payout exceeds its peer median.
All 8 peers for the company are dividend paying stocks. Over the last twelve months (prior to 2012-06-30), AXP-US’s dividend payout of 17.8% and the corresponding dividend yield of 1.3% (relative to the current price) compare to a peer median level of 8.3% and 0.6% respectively. Relative to its peers, the firm is generating a high dividend yield with a high dividend payout, which suggests a possible downward pressure on the dividend based on this traditional analysis.
Dividend Coverage
Over the last twelve months (prior to 2012-06-30), AXP-US paid a medium quality dividend.
The source of the company’s cash to support the dividend paid over the last twelve months is operating cash flow (coverage of 14.7x), investing cash flow (coverage of -8.9x), issuance cash flow (coverage of -5.7x) and twelve-month prior cash (coverage of 26.8x), for a total dividend coverage of 27.5x. AXP-US’s issuance cash flow includes outflows from net debt repayment (coverage of -7.1x) and net share buybacks (coverage of -3.4x). Thus, the total coverage including share buybacks is 30.9x, which reflects our assumption that the cash paid for share buybacks is discretionary and could instead be used to pay dividends.
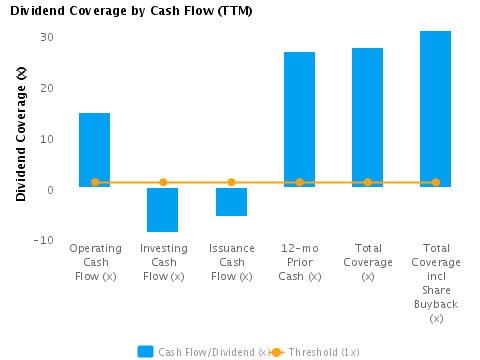
These coverage ratio factors imply that the firm’s net cash inflow from issuance was required (in addition to operating and investment cash) to pay the dividend, which suggests a medium dividend quality. AXP-US’s dividend quality is in line with a majority of its peers, which comprise 2 high quality, 5 medium quality and 1 low quality.
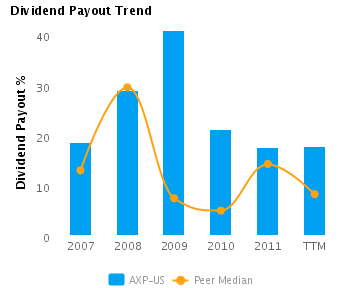
Dividend quality varied between high, medium and low over the last five years.
AXP-US has paid a dividend in each of its last five years. The distribution of dividend quality over this period consists of 2 high, 2 medium and 1 low. In particular, the dividend paid in 2011 was of high quality, compared to a medium quality dividend in the prior year.
AXP-US’s dividend has a strong cushion from the ending cash balance.
Though the dividend yield is high relative to peers, it is of medium quality in this period. Assuming the cash dividend paid remains constant, the medium quality coverage would need to deteriorate by 69% before the company dips into its beginning cash balance to fund the dividend payment.
Thus, the level of deterioration in overall cash flows would have to be quite severe suggesting that the current dividend quality is relatively robust. The ending cash balance, with a dividend coverage of 26.5x, provides a substantial cushion in case of a significant reduction of cash flows in the future.
Company Profile
American Express Co. is a global payments and travel company. The company, through its subsidiaries, offers products and services including charge and credit payment card products and travel-related services to consumers and businesses around the world. It focuses on generating alternative sources of revenue on a global basis in areas such as online and mobile payments and fee-based services. The various products and services are sold globally to diverse customer groups, including consumers, small businesses, mid-sized companies and large corporations through various channels, including direct mail, online applications, targeted direct and third-party sales forces and direct response advertising. American Express operates through four reportable segments: U.S. Card Services, International Card Services, Global Commercial Services and Global Network & Merchant Services. The U.S. Card Services segment offers a wide range of card products and services to consumers and small businesses in the United States and provides travel services to card members and other customers. The International Card Services segment offers proprietary consumer and small business cards outside the United States. The Global Commercial Services segment provides expense management services to companies and organizations worldwide through its Global Corporate Payments and Global Business Travel businesses. Global Corporate Payments offers a range of expense management solutions to companies worldwide through its Corporate Card Programs and Business-to-Business Payment Solutions. Global Business Travel provides globally integrated solutions, both online and offline, as well as through mobile applications, to help organizations manage and optimize their travel investments and service their traveling employees. The Global Network & Merchant services segment operates a global payments network that processes and settles proprietary and non-proprietary card transactions. It also provides point-of-sale products, multi-channel marketing programs and capabilities, services and data, leveraging the global closed-loop network. The company was founded by Henry Wells, William G. Fargo and John Warren Butterfield on March 28, 1850 and is headquartered in New York, NY.
Disclaimer
The information presented in this report has been obtained from sources deemed to be reliable, but AnalytixInsight does not make any representation about the accuracy, completeness, or timeliness of this information. This report was produced by AnalytixInsight for informational purposes only and nothing contained herein should be construed as an offer to buy or sell or as a solicitation of an offer to buy or sell any security or derivative instrument. This report is current only as of the date that it was published and the opinions, estimates, ratings and other information may change without notice or publication. Past performance is no guarantee of future results. Prior to making an investment or other financial decision, please consult with your financial, legal and tax advisors. AnalytixInsight shall not be liable for any party’s use of this report. AnalytixInsight is not a broker-dealer and does not buy, sell, maintain a position, or make a market in any security referred to herein. One of the principal tenets for us at AnalytixInsight is that the best person to handle your finances is you. By your use of our services or by reading any of our reports, you’re agreeing that you bear responsibility for your own investment research and investment decisions. You also agree that AnalytixInsight, its directors, its employees, and its agents will not be liable for any investment decision made or action taken by you and others based on news, information, opinion, or any other material generated by us and/or published through our services. For a complete copy of our disclaimer, please visit our website www.analytixinsight.com.
This article was originally written by abha.dawesar, and posted on CapitalCube.


