This real world experience with this relationship over my first decade in the industry convinced me that there truly was an inverse relationship between stock values and interest rates. Furthermore, my P/E and Interest Rates graph provided prima facie evidence that the theory was sound. In addition to the timeframes mentioned above, the inverse relationship between interest rates and stock prices stayed true to form from 1980 through 2000. During this period of time, interest rates steadily declined and conversely, stock prices and P/E ratios as measured by the S&P 500 steadily rose. All was right with the universe.
However, the validity of the interest rate versus stock value theory has been greatly tested from calendar year 2000 to present day. Interest rates continued to fall to historically low extremes and P/E ratios followed suit. Consequently, the inverse theory between rates and stock values no longer was working over this timeframe. How could it be that stock valuations (S&P 500 P/E ratios) and interest rates (10-year Treasury rates) moved down in almost perfect lockstep since calendar year 2000?
It did not take me long to find the answer. Just as interest rates had reached extreme levels in the early 1980s, stock valuations reached extreme levels that peaked by calendar year 2000. Therefore, the answer was clear. The theoretical inverse relationship between stock valuations and interest rates was – and still is – real. However, as previously stated, there are also many other factors that come into play. Simply stated, extreme valuation trumped the benefit of falling interest rates. In other words, even though interest rates were dropping, the headwinds of overvaluation diluted the effect. Next, I will introduce and discuss several of these other factors that can influence stock returns.
P/E Ratios and Interest Rates
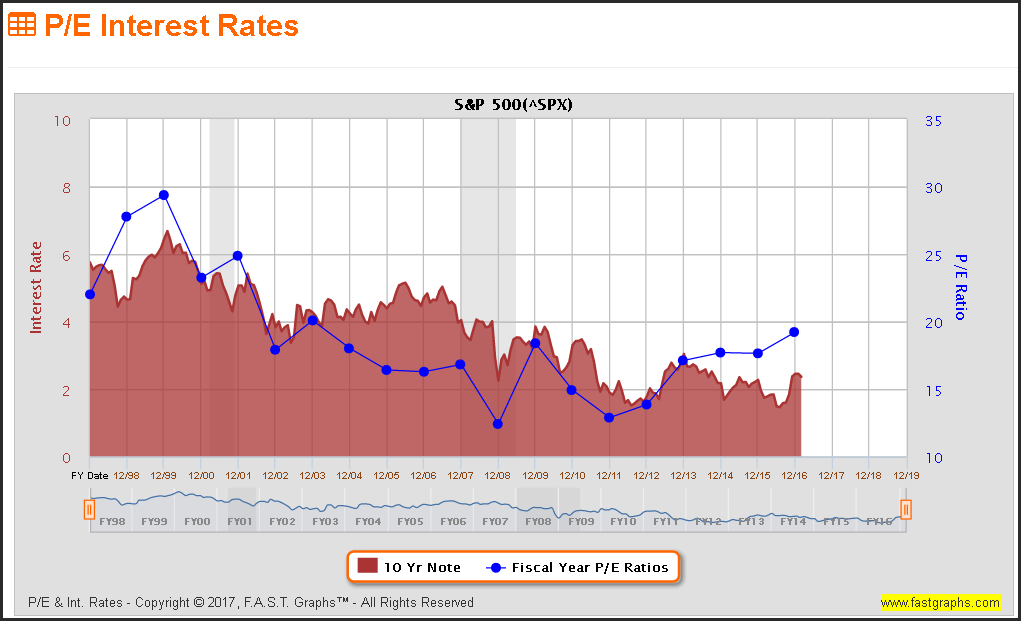
The following graph correlates historical year-end P/E ratios (the dark blue line) of the S&P 500 with the historical yields of the 10-year Treasury (the red line and shaded area). As you can see, the P/E ratio of the S&P 500 steadily declined from its peak of 29.37 at year-end 1999 to its low of 12.41 by year-end 2008, the throes of the Great Recession. This occurred during the same time when the yield of the 10-year Treasury went from 6.45% by year-end 1999 to a low of 2.25% by year-end 2008.
During this timeframe, stock valuations (P/E ratios) and interest rates both declined simultaneously. Under the theory described above, P/E ratios should have been increasing as interest rates fell. As I will illustrate with the next graphic, the headwinds of extreme stock valuations were the cause. However, the expected relationship seems to be gaining traction post-2008 as P/E ratios have increased and interest rates continued to move lower.
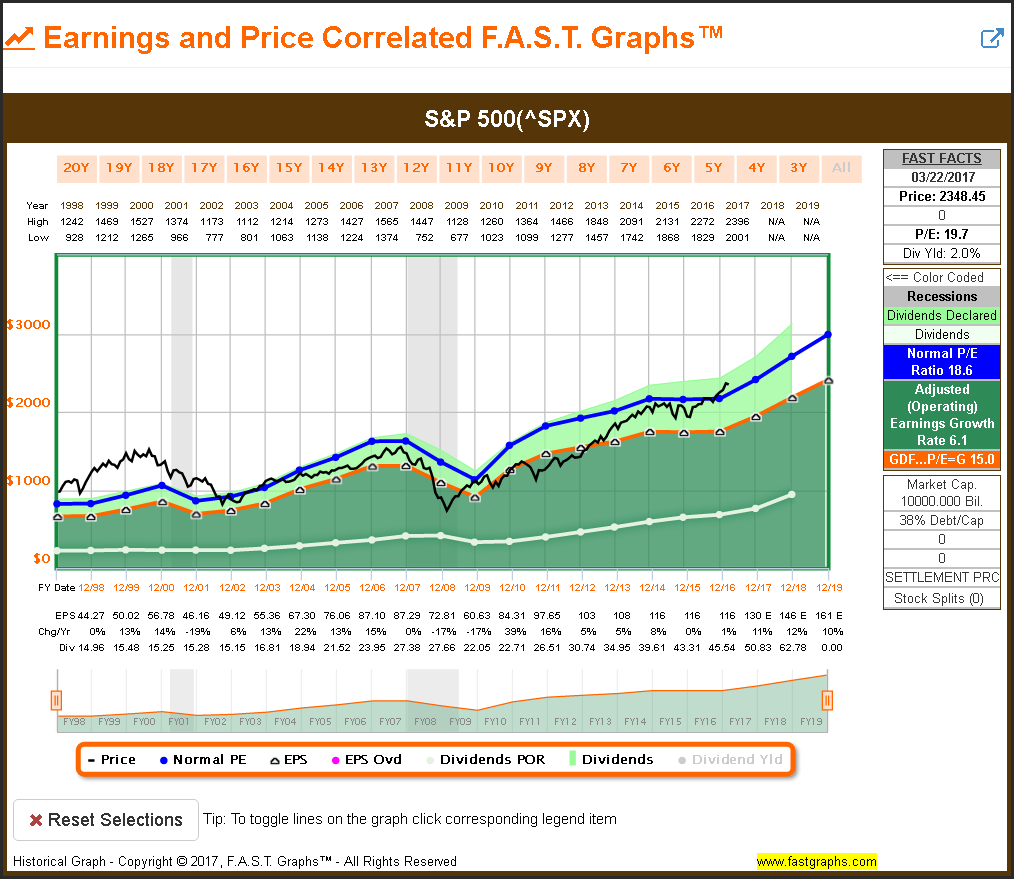
The earnings and price correlated graph of the S&P 500 below provides insights into some of the other factors affecting stock values referenced above. For starters, note extreme overvaluation from 1998 to 2000 when the S&P 500 stock price was significantly above the orange fair valuation reference line. Consequently, stock prices – and with them the P/E ratio of the S&P 500 – declined as a result.
Additionally, the other factor that should be considered in this analysis is the growth of earnings that transpired during that timeframe. Therefore, once stock prices became more in alignment with fair value, long-term growth of earnings generated positive shareholder returns in spite of lower P/E ratios for the S&P 500. Furthermore, we also see the effects of falling earnings during the Great Recession driving stock prices temporarily lower.