
Lockheed Martin Corp.’s analysis versus peers uses the following peer-set: The Boeing Company (NYSE:BA), EADS NV (EPA:EAD), General Dynamics Corporation (NYSE:GD), Raytheon Company (NYSE:RTN), BAE SYSTEMS PLC ORD (PINK:BAESF), Northrop Grumman Corporation (NYSE:NOC), Dassault Aviation SA (EPA:AM), Rockwell Collins, Inc. (NYSE:COL) and Finmeccanica SpA (BIT:FNC). The table below shows the preliminary results along with the recent trend for revenues, net income and returns.
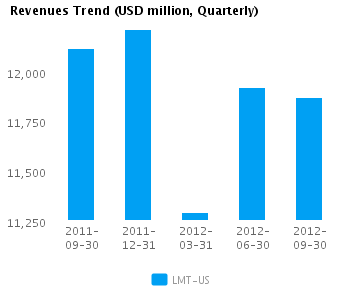
| Quarterly (USD million) | 2012-09-30 | 2012-06-30 | 2012-03-31 | 2011-12-31 | 2011-09-30 |
|---|---|---|---|---|---|
| Revenues | 11,869.0 | 11,921.0 | 11,293.0 | 12,211.0 | 12,119.0 |
| Revenue Growth % | (0.4) | 5.6 | (7.5) | 0.8 | 4.9 |
| Net Income | 727.0 | 781.0 | 665.0 | 698.0 | 665.0 |
| Net Income Growth % | (6.9) | 17.4 | (4.7) | 5.0 | (10.4) |
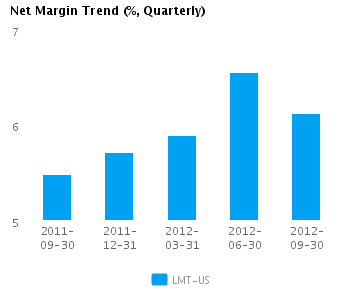
| Net Margin % | 6.1 | 6.6 | 5.9 | 5.7 | 5.5 |
| ROE % (Annualized) | 125.2 | 165.4 | 206.7 | 141.6 | 85.4 |
| ROA % (Annualized) | 7.5 | 8.1 | 7.0 | 7.5 | 7.4 |
Valuation Drivers
Lockheed Martin Corp. currently trades at a higher Price/Book ratio (12.2) than its peer median (4.4). LMT-US’s operating performance is higher than the median of its chosen peers (ROE of 106.6% compared to the peer median ROE of 19.2%) but the market does not seem to expect higher growth relative to peers (PE of 10.5 compared to peer median of 10.5) but simply to maintain its relatively high rates of return.
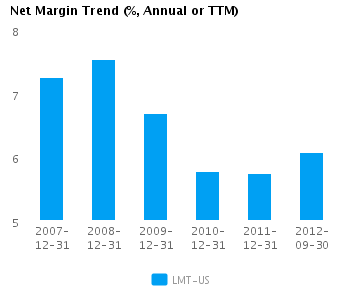
The company’s median net profit margins of 6.1% and relative asset efficiency (asset turns of 1.3x compared to peer median of 0.9x) give it some operating leverage. LMT-US’s net margin is similar to last year’s low of 5.7%, which compares to the 2008 high of 7.5%.
Economic Moat
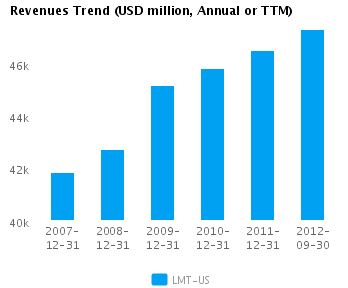
The company has achieved better revenues growth than its chosen peers (year-on-year change in revenues of 1.5%) but its earnings growth performance has been below the median (change in annual reported earnings of 0.8% compared to the peer median of 6.6%). This suggests that, compared to its peers, the company is focused more on top-line revenues. LMT-US is currently converting every 1% of change in revenue into 0.5% change in annual reported earnings.
LMT-US’s return on assets is above its peer median both in the current period (7.6% vs. peer median 6.2%) and also over the past five years (8.9% vs. peer median 4.8%). This performance suggests that the company’s relatively high operating returns are sustainable.
The company’s comparatively low gross margins of 12.4% versus peer median of 21.3% suggests that it has a non-differentiated strategy or is in a pricing constrained position. However, LMT-US’s pre-tax margin of 8.6% is around the peer median which, when combined with the gross margin, suggests lower operating costs relative to peers.
Growth & Investment Strategy
LMT-US’s revenues have grown at about the same rate as its peers (2.9% vs. 2.6% respectively for the past three years). Similarly, the stock price implies median long-term growth as its PE ratio is around the peer median of 10.5. The historical performance and long-term growth expectations for the company are largely in sync.
LMT-US’s annualized rate of change in capital of 3.8% over the past three years is higher than its peer median of 3.0%. This investment has generated an above peer median return on capital of 33.5% averaged over the same three years. Evidently, the relatively high capital investment was successful given the the relatively strong growth in its returns.
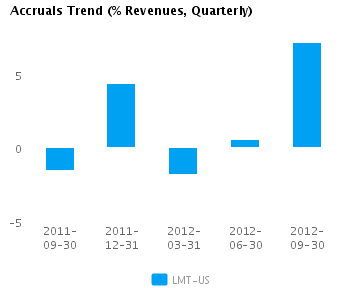
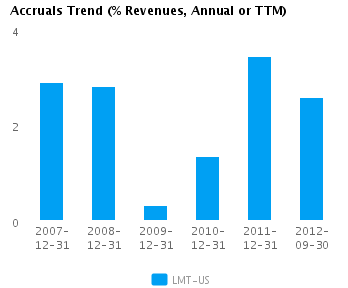
Earnings Quality
LMT-US’s net income margin for the last twelve months is around the peer median (6.1% vs. peer median of 7.3%). This average margin combined with a level of accruals that is around peer median (2.6% vs. peer median of 2.5%) suggests there possibly isn’t too much accrual movement flowing into the company’s reported earnings.
LMT-US’s accruals over the last twelve months are positive suggesting a buildup of reserves. However, this level of accruals is also around the peer median and suggests the company is recording a proper level of reserves compared to its peers.
Trend Charts
Company Profile
Disclaimer
This article was originally written by abha.dawesar, and posted on CapitalCube.


