Netflix, Inc. (NASDAQ:NFLX) shares have more than tripled over the past six months in a flurry of subscriber growth and big content wins. But not everyone is impressed.
The stock is heavily shorted. On Wall Street, you’ll find nearly as many “sell” recommendations on Netflix as “buy” calls. Fellow Fool Adam Levine-Weinberg is not a fan of Netflix at current prices, calling it overvalued and worrying over negative cash flows. And when I presented three positive surprises from Netflix, Inc. (NASDAQ:NFLX)’s latest monster quarter, one skeptical reader wondered how I can see the stock doubling in the next three years and “still not be worth this P/E.”
Fair enough. The P/E ratio does look scary, north of 700 times trailing earnings. Negative cash flows are never comfortable, particularly for investors trained in the Foolish school of thought where cash is king. I get that. Netflix, Inc. (NASDAQ:NFLX) is not a stock for the faint of heart even with a few quarters of recently proven success under its belt.
But P/E ratios are a terrible metric for valuing Netflix, Inc. (NASDAQ:NFLX) today. And sometimes you have to burn cash today to build a reliable cash machine for tomorrow. Netflix is currently in that heavy investment phase of the digital-media era, and it would be a horrible mistake not to step on the accelerator as hard as possible right now.
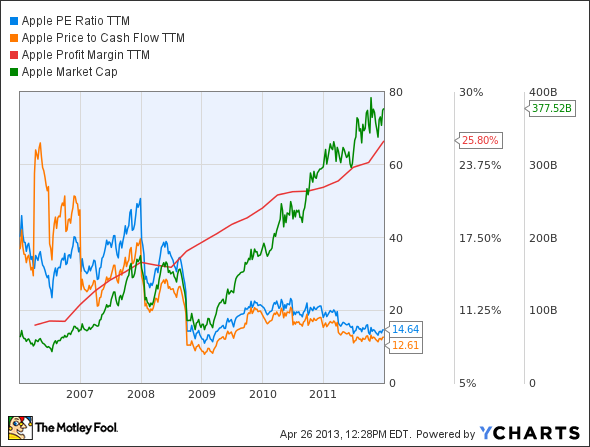
Let me show you a familiar precedent for this situation. Take a look at this chart, showing a company that was down on its luck in the early 2000s:

AAPL P/E Ratio TTM data by YCharts
Yes, that’s Apple (NASDAQ:AAPL) back in the iMac and iPod heyday. Earnings and cash flows were erratic and sometimes negative. Cupertino was breaking new ground in several important markets, starting with the music industry and preparing for the iPhone’s launch of a smartphone revolution.
P/E ratios were often sky-high or impossible to calculate back then, given Apple’s barely scraping-by financials. But that was only the surface story. Below the cracking veneer, Apple (NASDAQ:AAPL) was innovating and planning ahead. Steve Jobs had seen the future, and he was busy building it. Never mind if Apple’s market cap dipped for a while — the long-term payoff was sure to be fantastic.
What happened next is the stuff of legend:
AAPL P/E Ratio TTM data by YCharts
Apple (NASDAQ:AAPL) shares skyrocketed more than 1,100% between 2005 and 2012 as Steve’s vision turned the smartphone and tablet markets upside down. This was the game-changing future that Apple was spending its operating cash on a couple of years earlier.


