Oil and gas prices are cyclical in nature. The recent downturn in energy prices that started in 2014 has pushed energy stock prices, earnings and dividends lower. The question on the minds of many investors is what to do with their energy investments. I believe that studying history should provide some perspective on the situation.
Over the past 60 – 70 years, oil prices have generally moved up. However, this was not a gradual increase each year. It was rather a series of violent moves up and down, in order to confuse the maximum number of participants. For example, in the 1970s, oil prices move up a lot. During the 1980s, oil prices were mostly flat, with the occasional spike and bust ( like in 1986). The 1990s started out strong with the spike around the time of the first gulf war, only to keep sliding all the way down to multi-decade lows achieved in 1998.
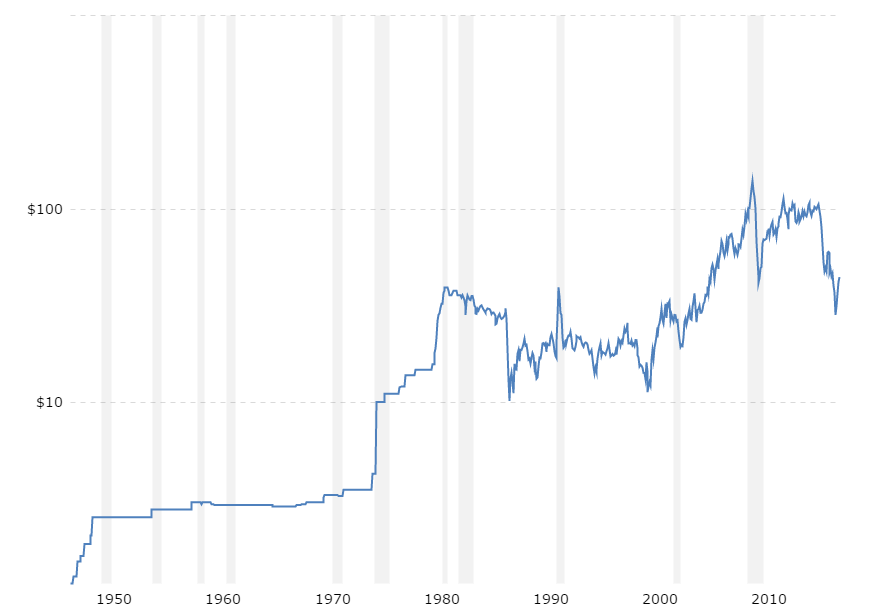
Source: Crude Oil Prices – 70 Year Historical Chart
Commodity producers are price takers – readers who read my analysis of BHP Billiton Limited (ADR) (NYSE:BHP) in 2013 hopefully learned that lesson, and avoided buying this company. There is very limited product differentiation between different types of crude for example, which is not sufficient to warrant a price premium that is immune to downward pressure in oil prices in general.
Cyclical companies are flush with cash and earn record profits at the top of the economic cycle. This is when high profits and high earnings per share result in very low P/E ratios. This is referred to as the peak earnings trap. For example, back in 2012, Exxon Mobil Corporation (NYSE:XOM) earned $9.70/share and sold at $86.55/share. This translated into a P/E ratio of 8.90. The company paid $2.18/share in dividends in 2012, which appeared to have very good coverage from earnings. Chevron Corporation (NYSE:CVX) on the other hand earned $13.32/share in 2012 and paid out $3.51/share in dividends. The stock price at $108.14/share looked cheap with a P/E ratio of 8.10. While I knew about the peak earnings trap, I viewed energy companies as better investments than other commodity plays such as metal companies.
At the bottom of the cycle however, profits are low. Given low earnings per share, P/E ratios look extremely high. Dividends look unsustainable. The bottom of the cycle is a trying time for investors, because it tests their patience. Investors’ patience is tested, because the fundamentals look terrible.
For example, Chevron Corporation (NYSE:CVX) closed 2015 at $89.96/share. The stock appeared very expensive with a P/E ratio of 36.70, if you are using the 2015 earnings of $2.45/share. Those earnings do not even cover the annual dividend of $4.28/share. In the case of ExxonMobil, the stock closed in 2015 at $77.95/share. The company earned $3.85/share in 2015, and paid $2.88 in annual dividend income. this translates into a P/E ratio of 20.20. The dividend is covered by earnings, and was recently increased. Chevron on the other hand is on track to lose its status of a dividend champion if it doesn’t raise dividends this year. I am on the record as stating that ExxonMobil’s dividend is possibly the only safe dividend in the energy sector today. This is why I am looking to adding to my position if we get further weakness in valuations.
At the end of 2015 there were 68 investors tracked by Insider Monkey with long stakes in Exxon Mobil valued at $3.08 billion, which amounted to just 0.9% of its float. That same pool of investors owned an identical 0.90% of Chevron’s float, as 44 investors had holdings worth a combined $1.48 billion. Thomas Bailard’s Bailard Inc opened a position in both stocks during the first quarter.
Follow Exxon Mobil Corp (NYSE:XOM)
Follow Exxon Mobil Corp (NYSE:XOM)
Receive real-time insider trading and news alerts
You have to have a very strong personality to ignore lower prices, and terrible looking fundamentals, because you understand the nature of the cyclical energy business. If you have analyzed the past, you would notice that the current downturn is nothing new under the sun. Studying the past should provide you with the perspective not to bail out when the going gets tough. At the bottom of the cycle, you will get all types of “stories” that are meant to scare you, which project the recent weaknesses onto the future indefinitely. In the current downturn environment, we are hearing about major oil producing countries which are facing financial difficulties, because they didn’t plan ahead. It is to be expected that countries, just like people, do not like to save during the boom times, in order to remain solvent during the downturns. The new stories we are hearing today however is that this downturn will never end, because somehow the world will embrace green energy, and we would all be singing kumbaya by the end of the decade.
I do not think that the world will stop using oil and natural gas right away. There are so many uses of these commodities, and we have so many entrenched economic activities around those commodities, that it would take several decades for ALL the countries in the world to reach a decision and act on it to replace oil & gas with green energy. Of course, as I mentioned above, commodities like oil are used in a lot of other activities, besides energy.
These stories ignore the facts that managements with great capital allocation skills can still provide value to shareholders, even if the price of the commodity is low and stays low for two decades. These managements can buy back shares if they are selling at attractive prices. They could also acquire other companies or merge with larger competitors, in an effort to reduce their costs.
It pays to own a diversified integrated company like Exxon Mobil Corporation (NYSE:XOM) or Chevron Corporation (NYSE:CVX). The E&P business is cyclical. The R&M business is cyclical as well. However, they usually run on different cycles, which offset each other to a certain extent. In the current downturn, R&M is doing fine. E&P only companies are the ones cutting dividends when things are tough, as evidenced by the recent moves with the likes of ConocoPhillips in early 2016.
The 1980s and 1990s were a miserable time for commodity companies. Despite all of those headwinds however, investors who followed a disciplined investment plan through thick and thin, managed to do pretty well for themselves.
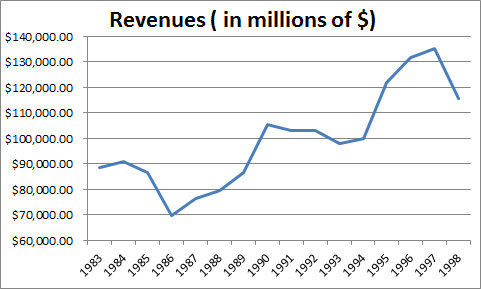
For example, I studied at the trends in revenues, net income, earnings per share and dividends per share for Exxon between 1983 and 1998. You may find that net income and revenues didn’t increase much for over 15 years in a row. Even then, Exxon was known for its conservative fortress like balance sheet. It deserved a premium for the fact that it was a quality company, which was extremely well run.
For example, revenues for Exxon increased from $88.5 billion in 1983 to $115.4 billion in 1998.
Exxon’s net income increased all the way from $4.978 billion in 1983 to $6.44 billion fifteen years later, despite the low energy prices. The impact of weak commodity prices was partially offset by the decrease in corporate tax rates. Another helpful factor was the decrease in interest rates during the period, which reduced the cost to borrow.
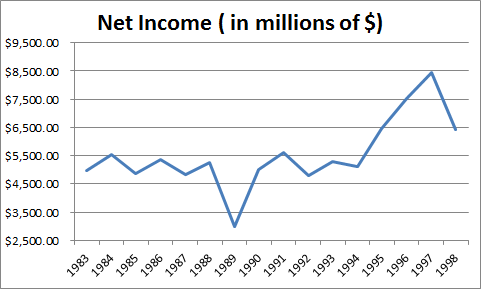
Earnings per share increased due to the superior capital allocation of management – going from 72 cents/share in 1983 all the way up to $1.31 in 1998. All the historical per share numbers for Exxon have been adjusted for stock splits. The decline in 1989 earnings per share was due to the Valdez oil spill. Earnings per share rebounded quickly after that.

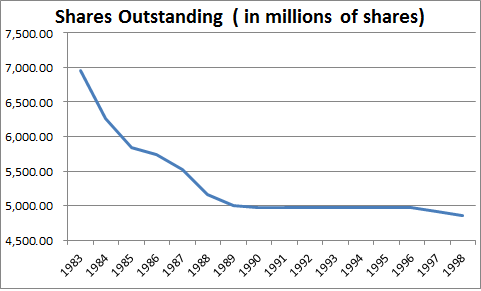
The high earnings per share growth was achieved mostly with the help of share buybacks reducing the number of shares outstanding. The company pursued a less aggressive program of regular share repurchases after the Valdez oil spill of 1989.
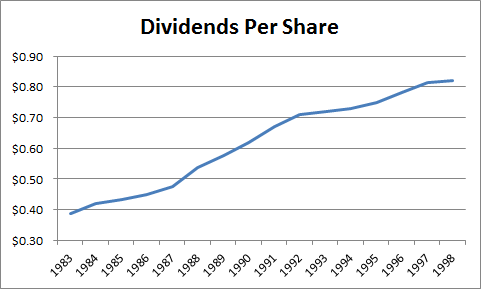
Dividends per share more than doubled during this period, from 39 cents/share in 1983 all the way up to 82 cents/share. Exxon’s management had chosen to raise dividends for 15 years in a row, and reward their patient long-term shareholders. This is what shareholder- centric management teams do.
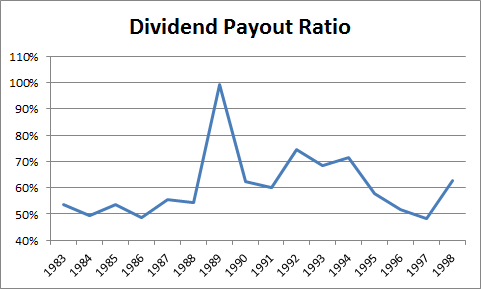
The dividend payout ratio was consistently above 50% during our study period. I remained above 50% between 1989 and 1996. I was surprised to learn that the best time to acquire the stock was during the time when the dividend payout ratios were so high.
The share price increased during the period, due to low valuation in the early 1980s, high yields, and the fact that interest rates were decreasing. The share price increased from $3.77/share in 1983 to $40.28/share by the end of 1999. When interest rates are decreasing, this boosts the value of corporations, since their cost of capital is cheaper and because equity prices look more favorable to investors when interest rates go down. The stock was cheap in 1983 at 5.20 times earnings and a dividend yield of 10.20%. By late 1999, the stock was yielding 33.80 times earnings and yielded 2.10%.

At the end of 1999, Exxon and Mobil merged in order to better withstand the challenging commodity environment, generate synergies through cost cuts and enrich shareholders. Earnings per share went up from $1.19 in 1999 to over $9.70 by 2012. The company kept repurchasing shares during those years, and has managed to eliminate the diminutive effect of the ExxonMobil merger in 1999 and the acquisition of XTO in 2010. If you had bought ExxonMobil stock in 1999, reinvested dividends for the next 17 years, you would be sitting on a nice gain of 224% and earning a yield on cost of 7.50%. Buying ExxonMobil in 1999 would have been difficult, because its operating performance was flat over the preceding 15 years. Yet, it turned out to be a good investment, because the business was about to turnaround.
So what is the lesson from all of this? The best way to conquer the ups and downs of the commodity cycle is to follow a disciplined plan of regular investment through the ups and downs. The future returns on companies are not predictable, and do not come on a schedule. Long periods of expansion, could be followed by long periods of things going nowhere. This is why it is important to stay the course through thick or thin, and to avoid bailing out at the first type of “trouble”. Please remember that it is time in the market that makes the most money for patient individual investors, and not timing the market.
In the case of Exxon Mobil Corporation (NYSE:XOM), investors today earn a starting yield of 3.50% – 4%. I believe that the dividend is safe. Let’s assume that oil and gas prices remain low, around current levels, for the next 10 – 15 years. This would translate into flat revenues and net income during those 10-15 years. When you have a high starting yield which is dependable, you do not need a lot of growth to compound net worth and income at a conservative average rate of rate.
It is quite possible that the company can squeeze in another 2.5% – 3% growth in annual earnings per share through cost cutting, share buybacks, and through strategic acquisitions of assets from smaller competitors which have fallen to bad times. This is a very conservative estimate. We know that small changes, compounded over time, could result in huge progress at the end of the study period. This means that an investor in ExxonMobil today, who reinvests their dividends, could conservatively expect to double their income and capital every decade, even if prices remain low. In my case, I would be interested in owning more of ExxonMobil if it falls to the low 70s/share and below.
If you put money to work each month for years in a company through the ups and downs, reinvest those dividends, and stick to your plan, chances are you will come out ahead. This only works for strong companies that are dominant in their industry. If you do this for a weak company with overleveraged balance sheet, you are taking a risk that a potential bankruptcy can take your investment plan down with it. I believe that an investor who follows a disciplined plan, where the regularly add to a company like ExxonMobil, and reinvest their dividends will do fine over the next 20 – 30 years. Preferably, this investor will keep these shares in a Roth IRA, in order to avoid paying any taxes on future dividends and capital gains.
Full Disclosure: Long XOM and CVX


