The markets still value American International Group Inc (NYSE:AIG) through the lens of 2008. But the AIG of today has materially improved its risk profile and generated financial results comparable to its peer group. Now is the time to invest, before the markets realize that today’s AIG isn’t the same company that got bailed out in September 2008.

The biggest difference: simplified risk
Over the past 5 years, American International Group Inc (NYSE:AIG)’s new management and board have worked to simplify its overall business. Leading up to the financial crisis, the complexity of AIG’s operations overwhelmed its risk controls and capital reserves, forcing the government to step in.
Today, AIG has shuttered or sold essentially all but its three core businesses: property and causality insurance, life and retirement insurance and services, and mortgage guaranty.
The derivatives book
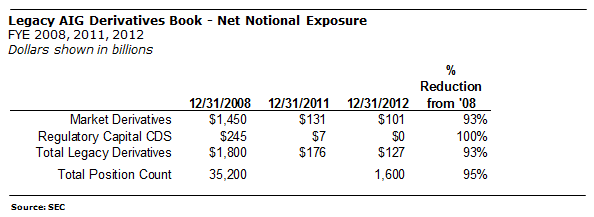
A core element of this simplification was reducing American International Group Inc (NYSE:AIG)’s exposure to complex derivative contracts. Driven primarily by derivatives tied to the public and secondary securities markets, these contracts were the largest single driver of the AIG’s failure.
As of Dec. 31, 2008, AIG had exposure to over $1.8 trillion of potential derivative liabilities, stemming from over 35,000 separate contracts. That exposure has now dwindled to just $127 million as of year-end 2012, a reduction of 93%.
Capital
With the reduction in derivatives exposure, American International Group Inc (NYSE:AIG) has also significantly improved its capital position. As of Dec. 31, 2008, AIG’s total shareholder equity represented 43.3% of total capital. Today that ratio stands at 79.5%. This improvement indicates both the simplification of AIG’s operations and its prudence in relying increasingly on common stock in its capital structure.
Furthermore, AIG has also deleveraged the balance sheet by 70%. The company’s ratio of financial debt to capital shrank from 42.3% in 2008 to 12.9% as of Dec. 31, 2012. The ratio is considerably more conservative than other large insurers, comparing to 22.7% at The Allstate Corporation (NYSE:ALL) and 22.2% at Travelers Companies Inc (NYSE:TRV). Simultaneously AIG has increased its book equity, with book value per share increasing 24% from 2011 to 2012 alone.
Is AIG making money?
From the doldrums of the recession, AIG has rebounded with three consecutive years of profitability. In December 2012, the company fully repaid the Treasury Department for the 2008 bailout, returning the original $182.3 billion bailout, plus an additional $22 billion in taxpayer profit.
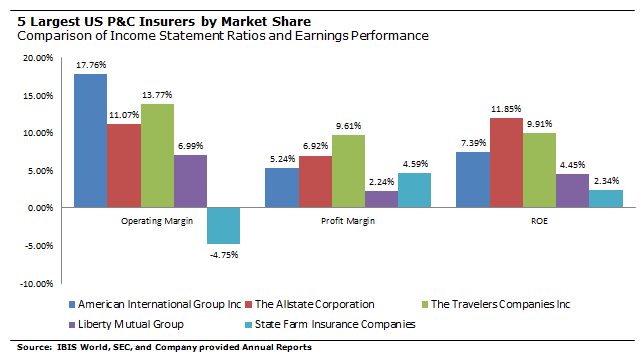
Before diving into the specifics of American International Group Inc (NYSE:AIG)’s income statement, it’s important to note that for this investment thesis, it is not critical for AIG to outperform its peers. AIG is so markedly undervalued relative to peer that we only need establish that performance is comparable.
AIG reported net income for FYE 2012 of $3.4 billion on total revenues of $65.7 billion. 2012 revenues represent a 9.8% increase over 2011, driven primarily by a 37.9% increase in net investment income. Total operating expenses (defined as “Benefits, Claims, and Expenses” for insurance companies) declined 5.6%.
Net income is a difficult comparison year over year due to one-time tax benefit of over $19 billion skewing the 2011 results. A reasonable proxy for comparing the earnings performance from 2011 to 2012 in this case is “Income from Continuing Operations Before Income Tax”, which increased from $116 million in 2011 to $9.3 billion in 2012.
For this analysis, we will define AIG’s peer group to be the top 5 P&C Insurers in the US according to IBIS World: State Farm Insurance
(11.7% market share), Liberty Mutual Group (7.3%), Allstate (6.0%), and Travelers (5.3%). AIG is fifth with 4.1% US market share.