The most recent news, as reported on Jan. 16 this year, is that Goldman Sachs and Morgan Stanley will pay a combined $557 million to mortgage borrowers over shoddy foreclosure practices ($232 million in cash payments to homeowners, along with $325 million in other assistance, such as loan modifications and forgiveness of deficiency judgments).
In other words, more “other expenses” eat into the bottom line, and perhaps more of it is yet to come this year.
Competition Analysis
Before we move in, let’s take a look at the table below.
| Companies | Beta | P/E Ratio | P/B Ratio | Total Asset Turnover | Return on Total Capital | Net Margin(%) | Total Debt/Capital Ratio | Interest Coverage |
| GS | 1.4 | 9.98 | 0.65 | 0.04 | 0.88 | 12.07 | 85.98 | 2.1 |
| State Street Corporation (NYSE:STT) | 1.45 | 13.29 | 1.04 | 0.05 | 4.14 | 18.41 | 53.28 | 6.2 |
| JPMorgan Chase & Co. (NYSE:JPM) | 1.39 | 8.93 | 0.71 | 0.05 | 2.39 | 28.6 | 74.76 | 3.4 |
| UBS AG (USA) (NYSE:UBS) | 1.73 | 14.98 | 0.78 | 0.03 | 1.01 | 13.9 | 87.39 | – |
| Morgan Stanley (NYSE:MS) | 1.59 | 16.87 | 0.48 | 0.04 | 0.58 | 22.84 | 85.24 | 0.9 |
| Citigroup Inc. (NYSE:C) | 2.58 | 16.9 | 0.43 | 0.06 | 1.46 | 16.1 | 75.35 | 1.4 |
Valuation – The P/E ratio of 9.98 and the P/B ratio of 0.65 are pretty much below everyone else in the table. The company seems to be not overly valued at the moment.
Efficiency – Total asset turnover (shows total revenue to total assets) gives you an indication of how well the company is using its assets to build revenue. In this case, Goldman Sachs still has to catch up with the State Street Corporation, JPMorgan Chase & Co. and Citigroup Inc..
Profitability – Return on total capital (ROTC – EBIT to total capital) says how profitable a company is at utilizing its capital. ROTC of 0.88 and net margin of 12.07% are still lower than industry averages.
Leverage – While total debt to total capital ratio (which indicates how much of the total capital is through debt) is pretty high at 85.98, the company is not sufficiently covering for the interest expense as per interest coverage ratio of 2.1 and ROTC of 0.88.
Riskiness – The company’s stock is not too risky with beta at 1.4, compared to 2.58 at Citigroup and 1.73 at UBS.
In short, while the company’s stock is not risky, the fundamentals of the company still do not convince me that it is of value. The company needs to keep on improving its profitability and strive to restrain debt from growing further.
Street Analysis
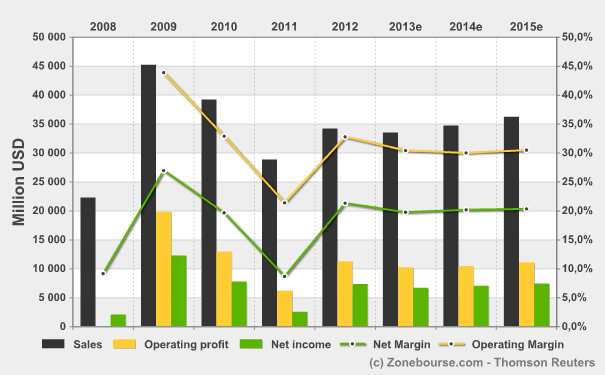
Revenue is expected to fall next year, yet keep on growing for the next couple of years until 2015. During this period, profitability margins will probably stay flat or rise nominally.
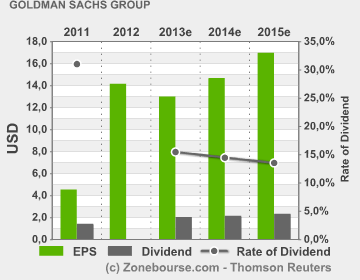
Even EPS is expected to grow in correspondence with the revenue growth.
But the main question is whether the P/E ratio will grow or not, because that will reflect in the stock price, right?
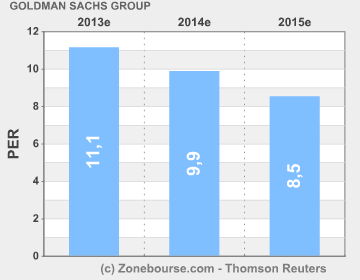
Looking at the image above, we can safely say that the stock price will gain sufficiently next year with the expected PER to reach 11.1, compared to the current PER of 9.98. But from 2014 onward, the PER is going down while the EPS is supposed to go up. Or, we can safely say that the price rise will flatten from 2014 onward. Or, it may go down if the EPS does not show sufficient appreciation.
Conclusion
If you are excited about QoQ revenue increase of 190%, think again. It might be a good time to buy the stock, but there still remains a question whether it still have become a high value play.
With the upcoming litigation costs, not-so-remarkable revenue growth, high leverage and lack of financial transparency, the company has still a lot more to show to be termed “high value.” Yes, it might be undervalued at the moment, which is stirring the buying craze. Still, questions on its performance in the next few years still remain.
In short, I am still neutral about this company.
The article Something To Know About Goldman Sachs originally appeared on Fool.com and is written by Suman Chatterjee.
Copyright © 1995 – 2013 The Motley Fool, LLC. All rights reserved. The Motley Fool has a disclosure policy.


