Colleges claim to be the melting pot of ideas, debates, and a peak into what future society will look like. If this concept is true, then Netflix, Inc. (NASDAQ:NFLX)‘s future looks fantastic! Before I graduated in December 2012, I took a stroll down the dorm that I called home during my freshmen year. The building was updated: new carpet, paint, furniture–but one thing that caught my eye was how many students were streaming Netflix movies in their rooms. Even though cable is “free” for the each student living in the dorms, I noticed the typical dorm student was watching a TV series or Friday night movie with friends via Netflix. Even the people I know off campus, unless they obtained a cable “promotional package” for a year, only had a Netflix or Netflix/Hulu combination for their TV consumption.

Enough about reminiscing about college–what about Netflix itself? Netflix is spending the cash to obtain content, such as its deal with Warner Bros that will allow Netflix to add programs such as Revolution and The Following.There are rumors of Netflix trying to court Sony Entertainment movies, and the December The Walt Disney Company (NYSE:DIS) deal has been a major hit with the ladies on campus…sorry, enough college talk.
Simply put, Netflix is investing into content and this strategy is the trump card it’ll use to beat the competition. On Feb. 1, Netflix released their first in-house TV series House of Cards. The series marks a first for online streaming services, but it also flips the conventional “wait a week for the next episode” as subscribers have the entire series available right from the start.
When it comes to the competition, Netflix is thrashing them with the content deals that Netflix has secured lately. Here is a snippet, and accompanying graphic, that were taken from Netflix’s latest 8-K:
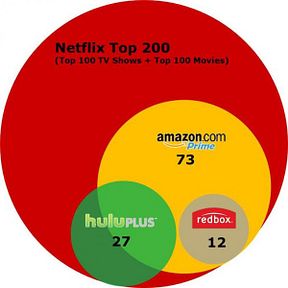
To the degree they have some of the same content as Netflix, [Amazon, Hulu Plus, and Redbox] are potentially a substitute for Netflix. To examine this, we looked at the top 200 titles on Netflix: our 100 most popular movies and our 100 most popular TV shows in Q4. Of these 200, 113 are not on Amazon (NASDAQ:AMZN) Prime, Hulu Plus or Redbox Instant. Of the 87 that are available on at least one of these services, Hulu Plus offers 27 of the 200; Amazon Prime 73 of the 200; and Redbox Instant 12 of the 200, with significant overlap in TV between Hulu Plus and Amazon Prime, and in movies between Amazon Prime and Redbox Instant. In other words, when it comes to the most popular content with members on Netflix, none of these services are good substitutes to Netflix.
In short: Netflix has the content, is securing more content, and now is in the business of producing its own content (ala: House of Cards). Things are looking up!
…and the numbers of Netflix
Content and exclusivity can only take us so far before we have to dive into the numbers.
| 4Q 2011 | 4Q 2012 | Growth/Decrease | |
| Subscriptions (Paid) | 20.15 million | 25.47 million | + 26.4% |
| Revenue | $ 476 million | $ 589 million | + 23.73% |
| International Subscriptions | 1.45 million | 4.89 million | + 237.24% |
| International Revenue | $ 29 million | $101 million | + 248.27% |
| International Net Profit | -$ 60 million | -$ 101 million | – 68.3% |
| Free Cash Flow | $34 million | -$ 51 million | – 250% |
| Cash on Hand | $ 798.35 million | ||
Information gathered from Netflix’s 8-Q
Impressive numbers to say the least! With growth numbers like those, it would be easy to get caught up in the hype that Netflix is riding high. But what holds me back from investing are the Free Cash Flow and the International Net Profit numbers. Sure, Netflix needs to invest money overseas to penetrate the emerging markets, but for how long can they take that kind of hit? And it gets worse.
Netflix is slowly slipping back into the “overhyped and overpriced” category again. The P/E for Netflix is 568.28. At that price, people are expecting amazing numbers all the time. The -250% year-over-year cash flow number does throw a wrench into the “growth” story for Netflix. On top of the negative cash flow, the P/E and cash (read: war chest to purchase content) situation is also slightly a scare. See the chart below:
| Company | P/E | Cash on Hand |
| Netflix (NASDAQ:NFLX) | 568.28 | $748.08 million |
| Apple (NASDAQ:AAPL) | 10.28 | $39.82 billion |
| Time Warner (NYSE:TWX) | 19.14 | $3.8 billion |
| Amazon.com (NASDAQ:AMZN) | N/A | $11.45 billion |
Notice how Netflix’s P/E and Cash on Hand are completely flipped against the competition. Do not get me wrong, $748 million is a sizable amount of money to lock up content deals with studios and even produce a series or two in house; however, Time Warner Inc. (NYSE:TWX) (HBO Go) and Amazon.com, Inc. (NASDAQ:AMZN) (Amazon Instant Video) both have ~5x and ~15x the cash purchasing power, respectively. Both companies have their eyes on the streaming crown. Expect 2013 to be a year of big content deals and potential exclusive content contracts.
The Foolish Line
Who is to say that Netflix won’t climb back up to its 2011 high of $295? It certainly has the potential. A handful of graduated friends who found jobs still stick with the Netflix or Netflix/Hulu combination as the preferred way to watch TV when “they have the time to watch.” I guess Netflix’s potential could be summed up this way:
Is this a quantitative (numbers, ratios) game, or is this a qualitative (content, exclusives, in-house productions) game?
The article Netflix 2.0: Cash vs. Content originally appeared on Fool.com and is written by David Henry.
Copyright © 1995 – 2013 The Motley Fool, LLC. All rights reserved. The Motley Fool has a disclosure policy.


