Amazon Hits An All Time High
Despite its climb from the March low, the S&P 500 was still down 11.03% year-to-date on Friday, while Amazon (AMZN), which hit an all-time high last week, was up 28.53%.


The spike in Amazon shares comes as the COVID-19 lockdowns have solidified the company’s dominance, as much of brick & mortar retail is closed and more home-bound consumers turn to ordering from Amazon. Amazon is currently one of Portfolio Armor‘s top 30 names, along with another company profiting from the Coronavirus crisis, Costco (COST).
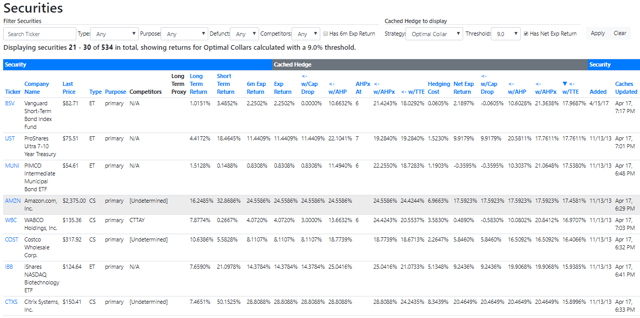
Screen capture via Portfolio Armor’s admin panel.
Given Amazon’s dominance, readers may wonder why I’d suggest its shareholders consider adding downside protection here. The reason has more to do with the market as a whole than Amazon.

The market’s rebound since late March suggests investors are optimistic about a v-shaped economic recovery following the contraction caused by the lockdowns. That’s in contrast to economists who suggest the recovery could take years. If the market ends up agreeing, we could see another leg down where leveraged investors are forced to liquidate even their best performers, like Amazon. With that in mind, let’s look at a couple of ways Amazon longs can add downside protection.
Downside Protection For Amazon
For these examples, I assume you have 200 shares of AMZN and can tolerate a decline of 20% over the next several months, but not one more than that. The screen captures below come from the Portfolio Armor iPhone app.
Uncapped Upside, Positive Cost
These were the optimal puts, as of Friday’s close, to hedge 100 shares of AMZN against a greater than 20% decline by mid-October.
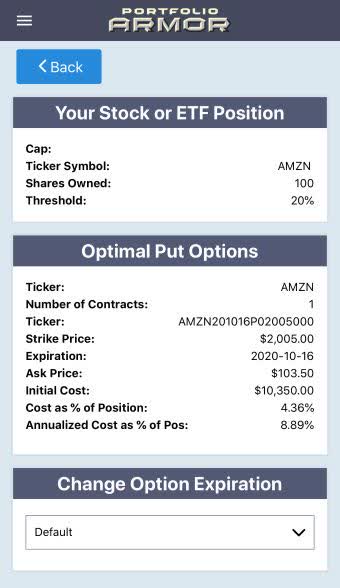
The cost of this protection was $10,350, or 4.36% of position value, calculated conservatively, using the ask price of the puts (in practice, you can often buy and sell options at some price within the spread between the bid and ask.). That worked out to an annualized cost of 8.89% of position value.
Capped Upside, Negative Cost
If you were willing to cap your possible upside at 20% over the same time frame, you could have used the optimal collar below to get the same level of protection as above.
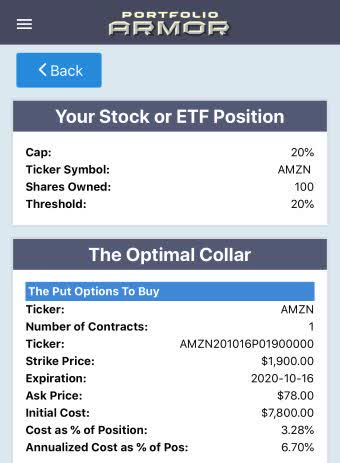
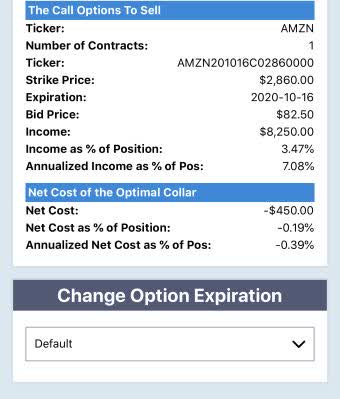
After an iterative process taking into account the net cost of the collar, the hedging algorithm identified a less expensive strike for the put leg. That lowered its cost to $7,800, or 3.28% of position value (calculated conservatively, at the ask). The cost of that put leg was more than offset by the income of $8,250, or 3.47% of position value (calculated conservatively, at the bid) generated by the short call leg.
So the net cost of this collar was negative, meaning you would have collected a net credit of $450, or 0.19% of position value, assuming you placed both trades at the worst ends of their respective spreads. That worked out to an annualized cost of -0.39% of position value.
Wrapping Up: Other Options
Both of the hedges above used our default options expiration date, which is the one closest to six months out. App users can use the drop-down to experiment with different expiration dates to see how the both the absolute cost and the annualized cost varies. As of Friday, for example, using the furthest out expiration date led to the lowest (most negative) annualized cost on the collars, while annualized cost jumped around a bit more on the put side.


