One of the most common company comparisons of the past few years that I’ve stumbled upon is between Intel Corporation (NASDAQ:INTC) and Advanced Micro Devices, Inc. (NYSE:AMD) – two of the leaders in the computer chip industry. Of course, Intel Corporation (NASDAQ:INTC) is ahead of Advanced Micro Devices, Inc. (NYSE:AMD) in the race. However, with lots of information out on the table about these two companies, how do their valuations compare?
While there are hundreds of things to consider when deciding whether one or the other belongs in your portfolio, one helping hand can be potential over- or undervaluation of either company. Here, I am going to use three different methods of valuating companies to show which takes the over/undervaluation title home, and to hopefully introduce you to a few handy metrics.
PEG Ratio
The PEG ratio (the Price/Earnings to Growth Ratio) helps to show the relationship between the price of a stock, the earnings per share, and the growth rate of the company. This metric is particularly useful when comparing companies side by side with different PE ratios and different growth rates. When analyzing the ratio, analysts typically classify companies with a PEG lower than 1 as associated with undervaluation, while companies above 1 tend to be overvalued. Now, let’s take a look at the graph for these two chip makers:

Clearly, Advanced Micro Devices, Inc. (NYSE:AMD) is potentially way overvalued, while Intel Corporation (NASDAQ:INTC) is potentially undervalued. This makes sense when looking at it from another angle; say, the value score angle. The value score is a measure from 1-10, from companies with a 10 tend to substantially outperform the S&P 500 and companies with a 1 tend to do the opposite. Intel’s score of 10 with their stock price (at time of writing, about $28.11) seem to add up to a summary of undervaluation. AMD’s value score over the last few years has been mostly about 4, with rare appearances around 6. So, according to this metric, Intel Corporation (NASDAQ:INTC) is potentially undervalued while Advanced Micro Devices, Inc. (NYSE:AMD) is potentially overvalued. Let’s move on to the next one.
Tangible Book Value Per Share
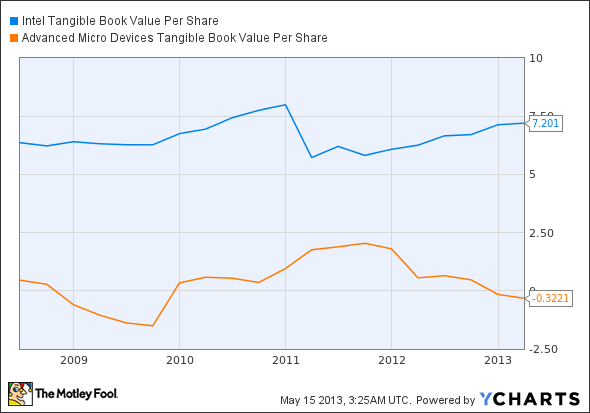
Tangible book value per share, or TBVPS, is a measurement of the portion of tangible assets (all assets, with the exception of goodwill and items classified as “intangible” on a company’s balance sheet) attributable to each share of the company’s common stock. What this means is that it is helpful in establishing the valuation of a company, and whether it may be over or undervalued. This is important because lots of companies’ balance sheets can reflect asset valuations that are inflated by intangibles; yet, if a company were to go bankrupt, the tangible value of assets a company has would be what is left over after bankruptcy. A simple way to put this would be that tangible book value answers the question, “as a shareholder, what would I receive if the company had to liquidate all of its assets?” By measuring this value per share, we create a ratio that measures valuation.
A TBVPS larger than the current price of the stock means that the stock could be potentially overvalued, whereas, obviously, a TBVPS smaller than the stock could mean that the stock is potentially undervalued. The formula, for those who are interested, for TBVPS is equal to: (Tangible Book Value – Book Value of Preferred Stock) / Common Shares Outstanding. Now, let’s look at each company’s TBVPS in relation to their stock price.
| TBVPS | Price ($) | TBVPS / Price (Valuation) | |
|---|---|---|---|
| Intel | 7.20 | 28.11 | .26 |
| AMD | -0.32 | 8.02 | -.04 |
So, according to this metric, both companies are potentially undervalued, with both companies having a TBVPS / Price ratio substantially below 1. Let’s move on to the third metric.
EV / EBITDA
This ratio tells the relationship between a company’s enterprise value (definition to follow) and its EBITDA, or its earnings before interest, taxes, depreciation, and amortization, a common value used to measure the earnings of a company. The enterprise value is a less-often used alternative to traditional measurements like market capitalization. EV is often considered to be the theoretical purchase price of a company should a purchaser takeover the company and thus take on the company’s debt, while keeping the cash and gaining rights to the future earnings of the company. (Exact calculation of EV: Enterprise Value = Market Capitalization + Current Portion of Long Term Debt + Notes Payable + Long Term Debt + Book Value of Preferred Stock + Book Value of Minority Interest – Cash and Cash Equivalents.)
The ratio between these two numbers tells us the valuation of a company per each dollar of EBITDA. This is often used by analysts to quickly see a company’s valuation multiples. A higher ratio tends to mean the company is potentially overvalued, while a lower ratio tends to mean an undervalued company. Let’s look at our two chip makers:

As the chart illustrates, the higher ratio belongs to Advanced Micro Devices, Inc. (NYSE:AMD), while Intel Corporation (NASDAQ:INTC) boasts the lower ratio, showing their potential undervaluation, where AMD may be overvalued.
Foolish bottom line
Of course, these valuations are all subjective and only part of the evaluating criteria of a company. Still, they should be considered when entering an industry as an investor. So, what conclusions should we take from our data? All three valuation techniques had Intel as a potentially undervalued stock, while two of the three we consulted had AMD as potentially overvalued. So, in case you needed another reason to invest in Intel instead of AMD when considering just these two chipmakers, here you are.
Hopefully this analysis of the computer chip maker industry was helpful in that it not only educated about the market, but about three new criteria to use in your company-evaluating arsenal.
The article Valuing the Computer Chip-Making Industry With 3 Ratios originally appeared on Fool.com and is written by Michael Nolan.
Copyright © 1995 – 2013 The Motley Fool, LLC. All rights reserved. The Motley Fool has a disclosure policy.


