Golden Ocean Group Limited (NASDAQ:GOGL) Q3 2022 Earnings Call Transcript November 16, 2022
Golden Ocean Group Limited misses on earnings expectations. Reported EPS is $0.35 EPS, expectations were $0.5.
Operator: Ladies and gentlemen, thank you for standing by. And welcome to the Q3 2022 Golden Ocean Group Limited Earnings Conference Call. I would now like to hand the conference over to your speaker today, the CEO, Ulrik Andersen. Please go ahead, sir.
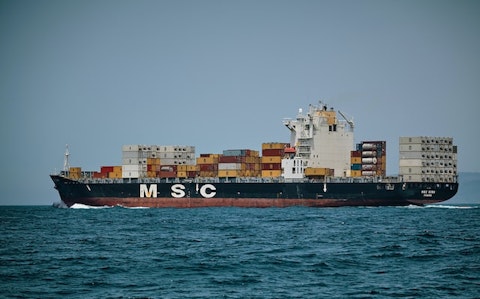
Photo by Vidar Nordli-Mathisen on Unsplash
Ulrik Andersen: Good afternoon, ladies and gentlemen and welcome to this conference call presenting Golden Ocean’s Q3 results. Thank you very much for listening in. Today’s call is the same procedure as usual. Peder Simonsen, sitting next to me, the company’s CFO, will talk us through some of the financial highlights. And hereafter, I will be discussing the market and the outlook for the company. In the next 15 to 20 minutes, we will show you that despite macroeconomic factors presenting a challenging backdrop, Golden Ocean generated solid results in the third quarter that we continued to divest non-core and older tonnage, taking advantage of firm asset prices. And that, despite an expected slowdown at the beginning of next year, the long-term dry bulk fundamentals remain strong.
With that, let’s take a look at the main highlights for the quarter. In Q3, we recorded an adjusted EBITDA of $118 million, which resulted in a net profit of $105 million or $0.52 per share. We achieved average TCE rates of $22.5 per day for our Capesizes and $23.5 for the Panamaxes. Like in Q1 and Q2, these earnings are well above benchmark indices. For the Capes, it is $9,000 per day per vessel better than the index. The premium is driven by scrubbers and our modern fuel-efficient fleet. Looking at this quarter, Q4, we have so far secured $23,000 per day for 75% of our Cape days and $19,000 per day for 78% of our Panamax days. Looking into Q1 next year, we have secured $21,000 per day for 4% of our Cape days and $21,000 per day for 20% of our Panamax days.
We also completed the sale of 2 Ultramax vessels, which are outside our core segments with a profit of $22 million. During the quarter, we also announced a share buyback program of up to $100 million. And finally, we announced our seventh consecutive quarterly dividend. We will pay up $0.35 per share. The dividend underlines our belief in the long-term fundamentals and takes the dividend we have paid since 2021 to almost $800 million. Now I will pass the word to Peder, who will dive into some of the numbers and financial details of the quarter.
See also 25 Most Capitalist Nations in the World and 15 Best Affordable Stocks To Buy Under $30.
Peder Simonsen: Thank you, Ulrik. If you move to Slide 5, we can have a look at our P&L for the quarter. Our time charter revenues, was impacted by solid contract coverage and strong chartering performance in a volatile freight rate and fuel price environment. Our total fleet-wide TCE rate came in at $23,000, down from $29,400 in Q2. We had 6 ships dry docked in Q3 versus 1 ship dry docked in Q2, resulting in approximately 272 days off-hire versus 187 in Q2. This resulted in TCE revenues of $195.6 million compared to $250 million in the second quarter. On our operating expenses, we recorded $59.3 million versus $50.4 million, which as mentioned was a result of the increase in number of ships dry docked and also installation of energy-saving devices and sensors of approximately $2 million in the quarter.
We saw lower COVID-19 related costs, as costs relating to quarantine hotels and testing has been lower, while we see freight costs on spares and has increased quite a bit in the quarter. Our operating expenses, excluding dry dock was $6,200 compared to $5,800 in Q2, while dry dock constituted $800 per day versus $74 per day in the last quarter. Our general and administrative expenses ended at $4.8 million, which is down from $5.5 million and constituting $529 per day net of recharge. Our charter hire expenses increased due to higher trading activity during the quarter, ending at $19.2 million, up from $15.4 million in Q2. Our adjusted EBITDA ended at $118.2 million versus $191.6 million in the second quarter. Moving to financial expenses, we have seen the higher reference rate being LIBOR and software, impacting both our interest rate expense and income and the net financial expenses ended at $14.4 million versus $11.9 million in the second quarter.
Moving to derivatives and other financial income, we recorded a gain of $17.3 million compared to a gain of $19.9 million in the second quarter. Most notable, we saw derivative portfolio, which is a portfolio of interest rate swaps, FFA and bunker derivatives, recorded a gain of $11.4 million versus $7.1 million in the second quarter. In addition, we saw results from investments in associates come in with a gain of $5.9 million versus $12.7 million in Q2, which relates to our investments in Swiss Marine, TFG and UFC. Our net profit came in at $104.6 million or $0.52 per share and a dividend of $0.35 was declared for the quarter. Moving to our cash flow on Slide 6, we recorded a net decrease in cash of $36.1 million. We had cash flow from operation of $98.7 million, down from $155.5 million in Q2.
We saw cash flow used in financing of $171.3 million, which is the aggregate of dividend payments pertaining to the second quarter of $120.5 million, debt and lease repayments of $50.8 million, which included $20 million in extraordinary debt repayment relating to the sale of the 2 Ultramax vessels mentioned before. We saw cash flow provided by investments of $36.6 million, which is the sales proceeds of the 2 Ultramax vessels of $61.7 million net and payment of newbuilding installments of $23.9 million. Moving to Slide 7, our balance sheet. We had cash on our balance sheet of $132.3 million at the end of the third quarter, which included $3 million in restricted cash securing our derivatives portfolio. In addition to that, we have $100 million in undrawn available credit lines at quarter end.
Our debt and lease liabilities totaled $1.3 billion at the end of the quarter. And our average fleet-wide loan-to-value on the company’s credit facilities was 42% at the end of the quarter versus 37% at the end of the second quarter. Our book equity was $1.9 billion and a ratio of equity to total assets of approximately 58% at the end of the third quarter. With that, I give the word back to Ulrik.
Ulrik Andersen: Thank you. Let’s start off with a quick review of the market developments in Q3. In the third quarter, the Panamax markets stayed firm, not as good as Q2, but still averaging $17,000 per day. The Panamax market was mainly driven by a healthy coal demand and new track routes emerging from the Russian invasion of Ukraine, including the UN grains corridor. The Cape market has suffered this year with the main culprits being the unwinding of congestion in China and a weak Brazilian iron ore export. Those factors continue to suppress the Cape market through most of July and August before we saw a recovery in early September. However, overall Cape rates did disappoint and averaged only $9,000 per day. The war in Ukraine and energy crisis and central banks moving to tighten monetary policies mean that the world is facing new challenges in the aftermath of COVID.
What was expected to be a continued strong recovery has been transformed into a stalling global economy with slower growth prospects and higher inflation. This is naturally densing the short-term demand prospects for dry bulk and has caused the markets to come under pressure, and we do expect a soft start to 2023. Having said that, the inflation rate in the U.S. slowed for the fourth month in a row in October and is now the lowest level since January, it eases the pressure on the U.S. Federal Reserve to continue its policy of increasing interest rates to battle inflation. Also worth noticing is that China, for the first time since the pandemic began, has announced an easening of some of the COVID restrictions. In addition, extra measures to support the real estate and infrastructure sectors were announced last week.
We expect that China will gradually reopen during 2023, which combined with stimulus will provide a boost to iron ore and steel demand. We are by no means out of the woods yet, and we do expect Q1 and most likely also part of Q2 to be challenging. However, with the historical low order book, I will talk about on the next slide, combined with the comeback of the Chinese economy next year, we remain optimistic that the market will rebound strongly. Turning the attention to the supply side on Slide 11, it is clear that the highly positive supply situation persist. As is well known, Golden Ocean is the largest listed owner of Capes. In this segment, the order book is below 6% which is a 30-year low. The already modest growth rate is before accounting for scrapping.
So in other words, the net supply of Capesize vessels will be lower. And with yards only taking orders for delivery in 2024, if you are lucky, or 2025, the order book is fixed for at least 2 years. Another reason for supply-side optimism is the commencement of the IMO 2023 regulations, which will reduce the efficiency of the fleet as many vessels will be forced to slow down to comply. The effect of IMO 2023 is hard to quantify. But all other things equal, it will require more vessels to move the same amount cargo if the global fleet on average is slowing down. Naturally, with such an attractive supply side, the market does not need particular growth. Normalized demand growth will be enough to outpace the supply and create very strong supply/demand fundamentals for the dry bulk market.
So putting supply and demand together, we expect an extended period of sustainable healthy earnings. The world may be facing headwinds in terms of inflation and slowing economies which means we are heading for so start to 2023. However, it is not enough to upset the long-term outlook for dry bulk, we believe. While we acknowledge macroeconomic factors, we do expect China to lift COVID restrictions next year, which will boost demand for dry bulk commodities, primarily iron ore. At the same time, we are looking at a historically low vessel supply situation, and there is nothing that can change that in the short-term given the lack of shipyard capacity. Combined with inefficient coal and grain trades and the impact of IMO 2023 regulation, it is practically impossible to have a negative view on the supply side and it will support a strong freight environment in the years to come.
As we have explained on previous calls, we always seek to secure fixed paid contracts when levels are attractive. And we do that in whatever segment, be it Cape of Panamax that offers the best value. We do not want to be fully at any time, and we seek to take out fixed contracts in the best possible market conditions. For Q4, we have 75% of the fleet covered at fixed rates averaging above $20,000 per day. That is $6,000 per day per vessel above the quarter-to-date benchmark rates. In other words, we are on track to beating the market significantly again this quarter. For Q1, we have 10% of our total fleet days covered. As it appears, we have focused on securing Panamax coverage rather than Cape coverage, simply because the Q1 pricing this year has been much more attractive for Panamaxes than for Capes.
We always balance our commercial strategy between the two segments to extract maximum value at the lowest risk. On the last slide today, we will focus on cash flow generation. Through well-timed acquisitions, economies of scale, low G&A and access to competitive finance, we have achieved industry low cash breakeven. And as it appears, Golden Ocean’s cash flow potential is substantial. For instance, looking at the time charter equivalent rates we have achieved year-to-date despite a challenging macro backdrop, would, on an annualized basis, generate more than $400 million in free cash. This is a direct yield of 21% on today’s share price. It’s support decision what we do with future earnings, but with a strong balance sheet and a fully funded newbuilding program, I believe it’s a fair assumption that Golden Ocean will continue to have dividends on top of the priority list when it comes to capital allocation.
Before opening up for questions, I’d like to shortly wrap up three main points from this release. Golden Ocean outperformed the market again in Q3 and delivered a solid net profit above $100 million. Despite a slowdown in the world economy and an expected slow start to 2023 for dry bulk, the 30-year low order book means that the fundamentals are in place for a strong rebound in freight rates. Golden Ocean continued to focus on returning capital to our shareholders. With the Q3 dividend, we have now paid almost $800 million since last year. And now we start the Q&A session. I therefore hand the word back to the operator. Thank you.
Q&A Session
Follow Golden Ocean Group Ltd (NASDAQ:GOGL)
Follow Golden Ocean Group Ltd (NASDAQ:GOGL)
Operator: The first question is from Greg Lewis from BTIG. Please go ahead. Mr. Lewis, your line is open. It’s from the line of Omar Nokta from Jefferies. Please go ahead.
Omar Nokta: Hi, thank you. Hi, guys. Good afternoon. I just have €“ just a quick one for you on the buyback and return of capital to shareholders in general. You’ve declared a $0.35 dividend. And overall, the buyback is a pretty sizable piece of the market cap, roughly 5%. Just in general, how are you thinking about that? You announced it in October. I’m sure there is blackout periods and whatnot of restrictions when you can use it. But have you put that capital to work yet? And how do you think about putting that capital currently, given where the stock is in relation to NAV and then also in relation to your outlook as we go into €˜23?
Peder Simonsen: Hi, Omar, yes, no, we haven’t blackout periods since we announced it. So we haven’t really been able to utilize it if we wanted to. When it comes to the share price, we haven’t traded that at a massive discount to NAVs following the announcement. So there has been some support on the share price. When it comes to €“ but that is €“ that is part of the market that we are in, and NAVs are always relative. But we are €“ we announced in the buyback program that we will utilize it as part of our capital allocation strategy. While we continue to prioritize dividends as the main sort of source of allocation, we have a 12-month program in place. And if we see value in buying back shares at a discount to NAV, we will, of course, take that opportunity. And we do expect as in line with our market outlook that we will go into a weaker part of the year right now and that will open up opportunities to buy back stock at attractive prices.
Omar Nokta: Okay. Yes. Understood. And then maybe just as a follow-up to that as we get into this potentially weaker part of the market. We have seen some softness in secondhand values. You clearly have critical mass across the Capes and Panamax. You have the handful of newbuildings also. So, there doesn’t seem to be a real need to go out and think about expansion. But do you think there are opportunities that are developing that you would look to maybe pick off a few ships here and there if prices come in further?
Ulrik Andersen: Yes. Hi. Ulrik here. Yes, is the short answer. We will of course, always monitor the market to see if there are attractive opportunities, whether that is buying or selling. And we can say, a more general note, we continue to find it attractive to divest our older vessels despite a slight weakening of asset prices, they are still historically very high. And we believe, at the same time, it’s the right thing to do to focus on decarbonization and to modernizing the fleet and keeping our average age down. But naturally, we are always on the lookout for opportunities that create shareholder value that are accretive. So, if something comes along, we would look at it. This is in our DNA.
Omar Nokta: Yes, definitely. Okay. Well, thank you. That’s it for me. I will turn it over.
Ulrik Andersen: Thank you.
