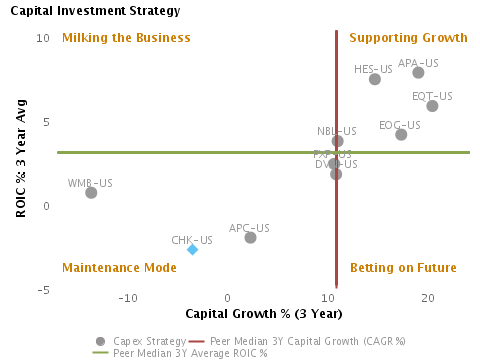
Capital Investment Strategy
CHK-US seems to be in maintenance mode.
CHK-US’s annualized rate of change in capital of -3.5% over the past three years is less than its peer median of 10.9%. This below median investment level has also generated a less than peer median return on capital of -2.7% averaged over the same three years. This outcome suggests that the company has invested capital relatively poorly and now may be in maintenance mode.
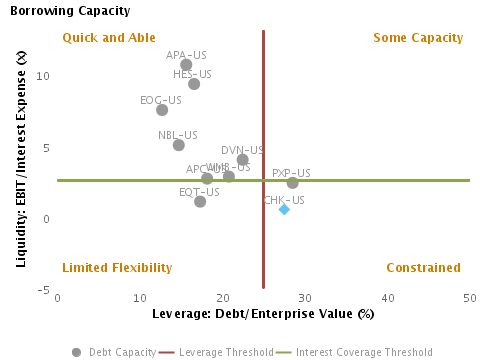
Leverage & Liquidity
CHK-US would seem to have a hard time raising additional debt.
With debt at 27.5% of its enterprise value compared to an overall benchmark of 25% (Note: The peer median is currently 17.7%), and relatively tight interest coverage level of 0.5x, CHK-US would have a hard time raising much additional debt. All 9 peers for the company have an outstanding debt balance.
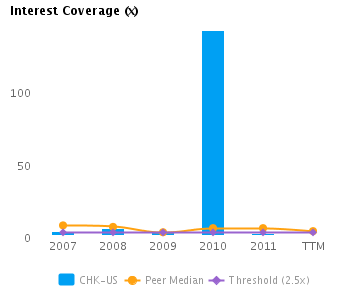
CHK-US has maintained its relatively low liquidity profile from the recent year-end.
CHK-US’s interest coverage is its lowest relative to the last five years and compares to a high of 141.5x in 2010. The decrease in its interest coverage to 0.5x from 1.8x (in 2011) was also accompanied by a decrease in its peer median during this period to 3.4x from 5.5x. Interest coverage rose 0.8 points relative to peers. It is also below the 2.5x coverage benchmark unlike the peer median.
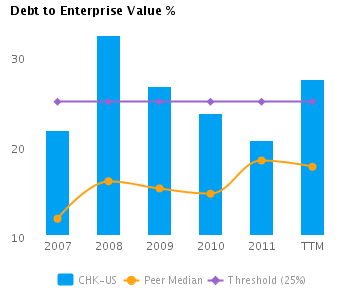
CHK-US’s debt-EV has increased 6.8 percentage points from last year’s low and is now above its five-year average debt-EV of 25.0. While its debt-EV increased to 27.5% from 20.7% (in 2011), its peer median decreased during this period to 17.7% from 18.4%. Relative to peers, debt-EV rose 7.5 percentage points. Unlike the peer median, it is also above the 25% leverage benchmark.
For Key Valuation Items, Revenues & Margins, Key Assets (% of Revenues), Key Working Capital Items, Cash Management Indicators, Key Liquidity Items, Key Cash Flow Items (% of Revenues) please log-in.
Company Profile
Chesapeake Energy Corp. (NYSE:CHK) explores, develops and produces oil and natural gas properties. Its principal activities include discovering and developing unconventional natural gas and oil fields onshore in the U.S. The company has also vertically integrated its operations and owns substantial marketing, midstream and oilfield services businesses directly and indirectly through its subsidiaries Chesapeake Energy Marketing, Inc., Chesapeake Midstream Development LP, Chesapeake Oilfield Services LLC, and Chesapeake Midstream Partners LP. Chesapeake Energy operates its business though the following segments: Exploration and Production; Natural Gas and Oil Marketing; Gathering and Compression; and Oilfield Services. The Exploration and Production segment is responsible for finding and producing natural gas and oil. The Marketing, Gathering and Compression segment is responsible for marketing, gathering and compression of natural gas and oil primarily from Chesapeake-operated wells. The Oilfield Services segment is responsible for contract drilling, oilfield trucking, oilfield rental, pressure pumping and other oilfield services operations for both Chesapeake-operated wells and wells operated by third parties. The company was founded by Aubrey K. McClendon and Tom L. Ward on May 18, 1989 and is headquartered in Oklahoma City, OK.
Disclaimer
The information presented in this report has been obtained from sources deemed to be reliable, but AnalytixInsight does not make any representation about the accuracy, completeness, or timeliness of this information. This report was produced by AnalytixInsight for informational purposes only and nothing contained herein should be construed as an offer to buy or sell or as a solicitation of an offer to buy or sell any security or derivative instrument. This report is current only as of the date that it was published and the opinions, estimates, ratings and other information may change without notice or publication. Past performance is no guarantee of future results. Prior to making an investment or other financial decision, please consult with your financial, legal and tax advisors. AnalytixInsight shall not be liable for any party’s use of this report. AnalytixInsight is not a broker-dealer and does not buy, sell, maintain a position, or make a market in any security referred to herein. One of the principal tenets for us at AnalytixInsight is that the best person to handle your finances is you. By your use of our services or by reading any of our reports, you’re agreeing that you bear responsibility for your own investment research and investment decisions. You also agree that AnalytixInsight, its directors, its employees, and its agents will not be liable for any investment decision made or action taken by you and others based on news, information, opinion, or any other material generated by us and/or published through our services. For a complete copy of our disclaimer, please visit our website www.analytixinsight.com.
This article was originally written by abha.dawesar, and posted on CapitalCube.


