This week we take a look at Chesapeake Energy Corporation (NYSE:CHK) starting today with an analysis of the company’s fundamentals. Our analysis later this week will cover our assessment of its likely Corporate Actions, Dividend Quality, and Earnings Quality.
 For details on how CapitalCube computes the Fundamental Analysis Score of a company read here. Our analysis is peer-based; we used the following peer set for analyzing Chesapeake: Anadarko Petroleum Corporation (NYSE:APC), EOG Resources, Inc. (NYSE:EOG), Apache Corporation (NYSE:APA), Devon Energy Corporation (NYSE:DVN), Williams Companies, Inc. (NYSE:WMB), Noble Energy, Inc. (NYSE:NBL), Hess Corp. (NYSE:HES) and EQT Corporation (NYSE:EQT).
![]()
If you are logged-in then you can change the default peer set (shown on the right) by either adding a new peer in the circled box or deleting any peers you don’t want by simply removing the checked peers. When you re-run the analysis Chesapeake will be scored and analyzed with your new custom peer set.
Fundamental Analysis 
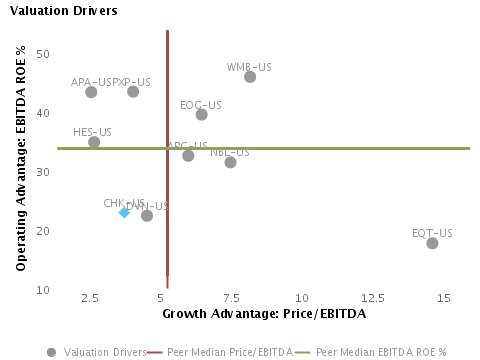
Chesapeake Energy Corp. trades at a lower Price/Book multiple (0.9) than its peer median (1.8).
CHK-US looks challenged given its below median EBITDA-based returns and the market’s low expectations of its growth.
CHK-US has relatively low profit margins and median asset efficiency.
Compared with its chosen peers, the company’s annual revenues and earnings change at a slower rate, implying a lack of strategic focus and/or lack of execution success.
CHK-US’s return on assets currently and over the past five years has trailed the peer median and suggests the company might be operationally challenged relative to its peers.
The company’s relatively low gross and pre-tax margins suggest a non-differentiated product portfolio and not much control on operating costs relative to peers.
While CHK-US’s revenue growth in recent years has been above the peer median, the stock’s Price/EBITDA ratio is less than the peer median suggesting that the company’s earnings may be peaking and the market expects a decline in its growth expectations.
The company’s relatively low level of capital investment and below peer median returns on capital suggest that the company is in maintenance mode.
CHK-US’s operating performance may not allow it to raise additional debt.
Company numbers are TTM (trailing twelve months) or latest available. Share price data is previous day’s close unless otherwise stated.
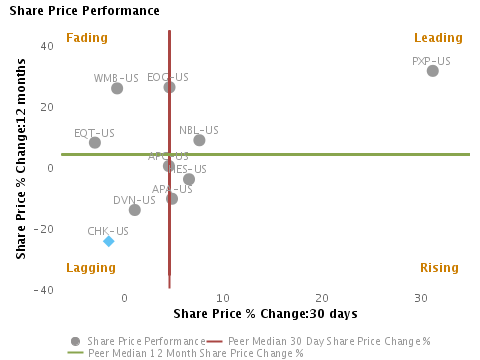
Share Price Performance
Relative underperformance over the last year and the last month suggest a lagging position.
Drivers of Valuation: Operations or Expectations?
Valuation (P/B) = Operating Advantage (ROE) * Growth Expectations (P/E)
CHK-US has a challenged profile relative to peers.