![]()
On April 25, the company reported first-quarter financial results. Compared to the same quarter in 2012, net income increased 5.29%, from $9.45 billion ($2 per share) to $9.5 billion ($2.12 per share). However, the disappointment that stemmed from the report was a result of total revenue falling 12.29% year over year. Wall Street sent the stock tumbling downward the next day.
The company possesses a TTM profit margin of 9.62%, which is anticipated to fall to the 8% mark by 2017. Based on market capitalization, the company is the second most valuable in the world at $403.33 billion. At current prices, the company pays out a dividend yielding 2.80%.
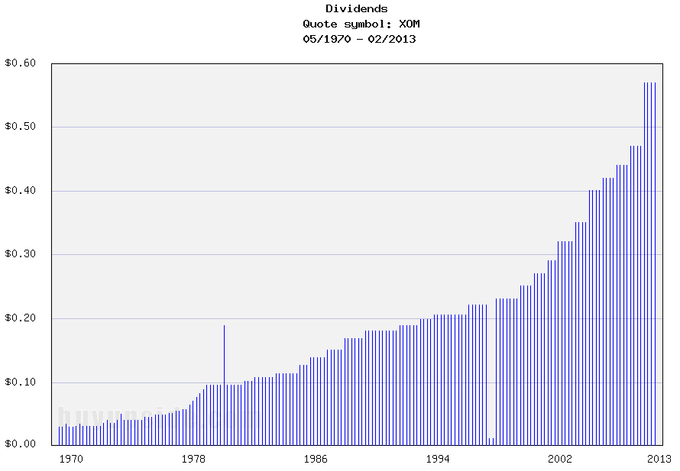
This energy giant recently announced an increase in its quarterly dividend payout, from $0.57 to $0.63, representing the 31st consecutive annual dividend increase by the company.
As Exxon nears all-time highs, is Exxon a solid long-term investment or should investors look elsewhere for black gold? Let’s try and find out.
Strengths:
Solid revenue growth:
In 2003, Exxon Mobil Corporation (NYSE:XOM) reported revenue of $246.74 billion; in 2012, the company announced revenue of $482.29 billion, representing year over year annual growth of 6.93%, a trend that it is highly anticipated to sustain into the future with projections placing 2019 revenue at $715 billion (this growth has been a result of consistent reinvestment by the company).
Dividend:
Currently, the company pays out quarterly dividends of $0.63, which annualized puts the dividend as yielding 2.80%, a major advantage for long-term investors.
Basement valuation:
At the moment, Exxon Mobil Corporation (NYSE:XOM) carries a price earnings ratio of 9.29, a price to sales ratio of 0.86, and a price to book ratio of 2.44; all of which indicate a company trading with a basement valuation.
Relatively low volatility:
Presently, the company has a beta of 0.50, representing a company trading with considerably less volatility than the overall market, a major advantage for long-term investors.
Cash flow position:
In 2011, Exxon generated $56.66 billion in cash flow, up from $30 billion in 2003, and this cash flow position is extremely important as it gives the company the financial security to reward shareholders.
Institutional vote of confidence:
46.25% of shares outstanding are held by institutional investors, equating to nearly $200 billion, displaying the confidence some of largest investors in the world have in the company and its future.
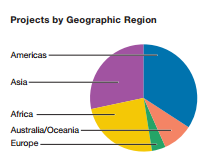
Broad diversification of business:
Exxon Mobil Corporation (NYSE:XOM)’s business is spread across the world, with no one region making up more than roughly 33% of overall business, and with this broad diversification comes a greater level of predictability and security for investors.
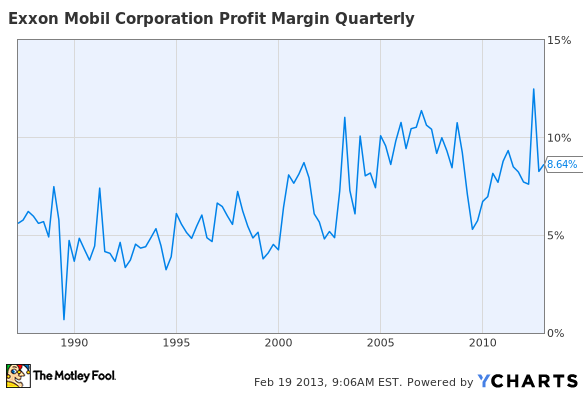
Long-term trend of margin expansion:
In 1990, the company’s profit margin was sitting around 5%, which has expanded to the current 8.64% level, and this trend of long-term margin expansion is a major strength.
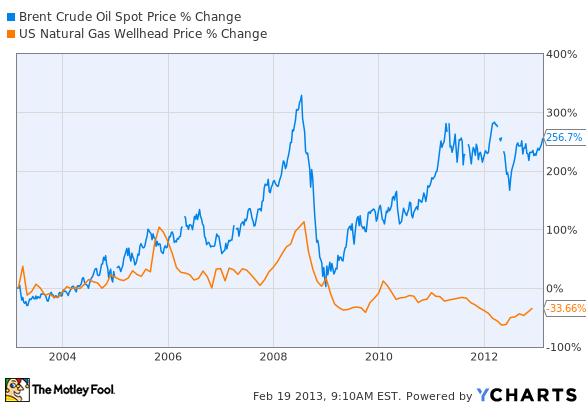
Strength in energy prices:

Threats:
Weakness in energy prices:
Faltering energy prices could squeeze the company’s margins and threaten its business.
Competitors:
Major publicly traded competitors of Exxon include Chevron Corporation (NYSE:CVX), BP plc (ADR) (NYSE:BP), TOTAL S.A. (ADR) (NYSE:TOT), and Eni SpA (ADR) (NYSE:E). All of these companies operate in the energy industry and compete directly with Exxon.
Chevron Corporation (NYSE:CVX) is valued at $239.90 billion, pays out a dividend yielding 3.24%, and carries a price to earnings ratio of 9.33. Chevron Corporation (NYSE:CVX), like Exxon, carries a basement valuation with a price to sales ratio of 0.99, and a price to book ratio of 1.76. Chevron possesses a rock solid business model with a TTM profit margin of 10.88%. However, this statistic is anticipated to decline in the future, with projections placing 2016’s margin at only 8.8%. Revenue is anticipated to drop until 2014, and then reverse course and hit 2008’s highs in 2016.
BP plc (ADR) (NYSE:BP) is valued at $139.71 billion, pays out a dividend yielding 4.78%, and carries a price to earnings ratio of 6.29. The company is still dealing with the shockwaves from the Gulf of Mexico disaster in terms of public relations, however, it is no longer a major weight on profitability. The company’s TTM profit margin currently sits at 5.65%, and the financial strength of the company is beginning to be reassured by growth in the company’s dividend. Revenue is expected to decline in mid-single digits until 2016.
TOTAL S.A. (ADR) (NYSE:TOT) is valued at $113.49 billion, pays out a dividend yielding 7.43%, and carries a price to earnings ratio of 10.20. Total’s business has experienced a notable contraction over the past half decade, with the TTM profit margin dipping from 15% to the current 4.77%. Revenue is anticipated to simply remain steady or slightly decline until 2016, while earnings are expected to grow at a low single digit rate.
Eni SpA (ADR) (NYSE:E) is valued at $87.86 billion, pays out a dividend yielding 5.76%, and carries a price to earnings ratio of 30.40. Eni SpA (ADR) (NYSE:E)’s TTM profit margin has declined from the 10%-15% range in 2006 to the current 6.09% mark, with projections expecting the profit margin to steady around the 6% level for the upcoming years. Revenue is expected to fall in low-single digits.
The Foolish bottom line
Financially, the only improvement Exxon Mobil Corporation (NYSE:XOM) should make is erasing its debt position. The company possesses a proven track record of consistent revenue growth, a growing dividend, and a basement valuation. Looking forward, Exxon should draw growth or at the least maintain its revenue stream from meeting growing demand for global energy and strengthening energy prices.
All in all, Exxon Mobil Corporation (NYSE:XOM) is a tremendous play on the global energy industry of tomorrow and should hand investors returns slightly better than those offered by the overall market for decades to come.
The article The King of the Energy World originally appeared on Fool.com and is written by Ryan Guenette.
Copyright © 1995 – 2013 The Motley Fool, LLC. All rights reserved. The Motley Fool has a disclosure policy.


