
Wal-Mart Stores Inc.’s analysis versus peers uses the following peer-set: Amazon.com, Inc. (NASDAQ:AMZN), Costco Wholesale Corporation (NASDAQ:COST), Target Corporation (NYSE:TGT), Dollar General Corp. (NYSE:DG), Macy’s, Inc. (NYSE:M), Kohl’s Corporation (NYSE:KSS), Dollar Tree, Inc. (NASDAQ:DLTR), Family Dollar Stores, Inc. (NYSE:FDO), Sears Holdings Corporation (NASDAQ:SHLD) and J.C. Penney Company, Inc. (NYSE:JCP). The table below shows the preliminary results along with the recent trend for revenues, net income and returns.
For CapitalCube’s Earnings Analysis of Macy’s Inc. (M) click here.
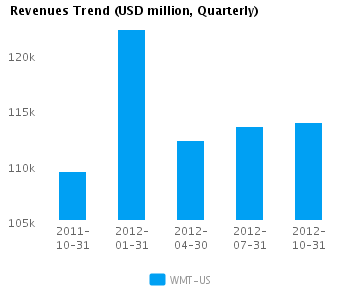
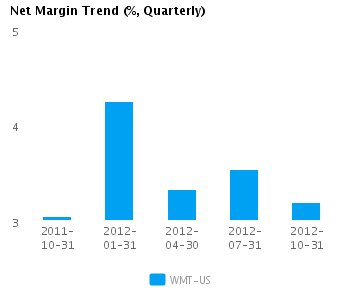
| Quarterly (USD million) | 2012-10-31 | 2012-07-31 | 2012-04-30 | 2012-01-31 | 2011-10-31 |
|---|---|---|---|---|---|
| Revenues | 113,929.0 | 113,534.0 | 112,272.0 | 122,285.0 | 109,516.0 |
| Revenue Growth % | 0.3 | 1.1 | (8.2) | 11.7 | 0.8 |
| Net Income | 3,635.0 | 4,016.0 | 3,742.0 | 5,194.0 | 3,344.0 |
| Net Income Growth % | (9.5) | 7.3 | (28.0) | 55.3 | (12.0) |
| Net Margin % | 3.2 | 3.5 | 3.3 | 4.2 | 3.1 |
| ROE % (Annualized) | 20.2 | 23.1 | 21.3 | 30.0 | 19.8 |
| ROA % (Annualized) | 7.2 | 8.2 | 7.7 | 10.7 | 6.9 |
Valuation Drivers
Wal-Mart Stores Inc. currently trades at a higher Price/Book ratio (3.1) than its peer median (2.3). WMT-US’s operating performance is higher than the median of its chosen peers (ROE of 23.5% compared to the peer median ROE of 18.9%) but the market does not seem to expect higher growth relative to peers (PE of 14.1 compared to peer median of 15.7) but simply to maintain its relatively high rates of return.
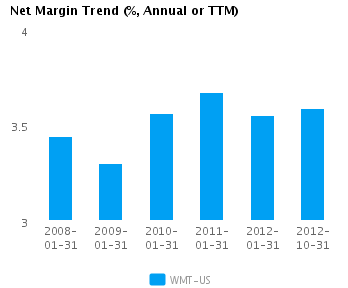
The company’s median net profit margins of 3.6% and relative asset efficiency (asset turns of 2.3x compared to peer median of 1.7x) give it some operating leverage. WMT-US’s net margin is similar to its five-year average net margin of 3.5%.
Economic Moat
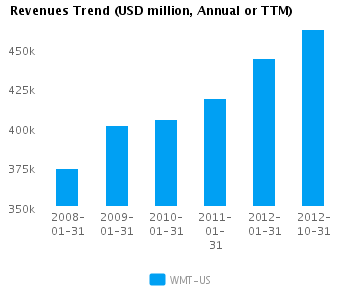
WMT-US’s revenues have changed in-line with its peers (year-on-year change in revenues is 5.9%) but its earnings have lagged (annual reported earnings have changed by 2.7% compared to the peer median of 4.8%), implying that the company has less control over its costs relative to its peers. WMT-US is currently converting every 1% of change in revenue into 0.5% change in annual reported earnings.
WMT-US’s return on assets is above its peer median both in the current period (8.3% vs. peer median 6.3%) and also over the past five years (8.4% vs. peer median 6.1%). This performance suggests that the company’s relatively high operating returns are sustainable.
The company’s gross margin of 26.3% is around peer median suggesting that WMT-US’s operations do not benefit from any differentiating pricing advantage. In addition, WMT-US’s pre-tax margin of 5.5% is also around the peer median suggesting no operating cost advantage relative to peers.
Growth & Investment Strategy
While WMT-US’s revenues growth has been below the peer median in the last few years (3.4% vs. 4.7% respectively for the past three years), the market still gives the stock an about peer median PE ratio of 14.1. The market seems to see the company as a long-term strategic bet.
WMT-US’s annualized rate of change in capital of 5.1% over the past three years is higher than its peer median of 1.9%. This investment has generated an above peer median return on capital of 13.1% averaged over the same three years. Evidently, the relatively high capital investment was successful given the the relatively strong growth in its returns.
Earnings Quality
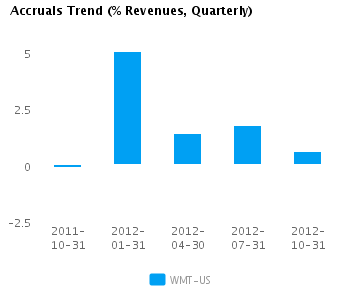
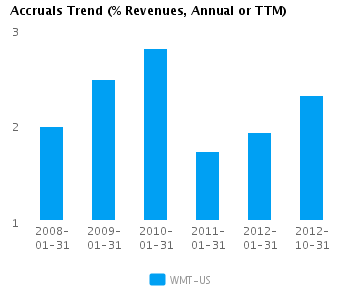
WMT-US’s reported net income margin for the last twelve months is around the peer median (3.6% vs. peer median of 4.1%). However, the company has also recorded a relatively low level of accruals (2.3% vs. peer median of 3.7%) which suggests possible overstatement of its reported net income.
WMT-US’s accruals over the last twelve months are around zero. However, this modestly positive level is also less than the peer median which suggests some amount of building of reserves.
Trend Charts
Company Profile
Disclaimer
The information presented in this report has been obtained from sources deemed to be reliable, but AnalytixInsight does not make any representation about the accuracy, completeness, or timeliness of this information. This report was produced by AnalytixInsight for informational purposes only and nothing contained herein should be construed as an offer to buy or sell or as a solicitation of an offer to buy or sell any security or derivative instrument. This report is current only as of the date that it was published and the opinions, estimates, ratings and other information may change without notice or publication. Past performance is no guarantee of future results. Prior to making an investment or other financial decision, please consult with your financial, legal and tax advisors. AnalytixInsight shall not be liable for any party’s use of this report. AnalytixInsight is not a broker-dealer and does not buy, sell, maintain a position, or make a market in any security referred to herein. One of the principal tenets for us at AnalytixInsight is that the best person to handle your finances is you. By your use of our services or by reading any our reports, you’re agreeing that you bear responsibility for your own investment research and investment decisions. You also agree that AnalytixInsight, its directors, its employees, and its agents will not be liable for any investment decision made or action taken by you and others based on news, information, opinion, or any other material generated by us and/or published through our services. For a complete copy of our disclaimer, please visit our website www.analytixinsight.com.
This article was originally written by abha.dawesar, and posted on CapitalCube.


