J.B. Hunt Transport Services, Inc. (NASDAQ:JBHT) recently reported its preliminary financial results based on which we provide a unique peer-based analysis of the company. Our analysis is based on the company’s performance over the last twelve months (unless stated otherwise). For a more detailed analysis of this company (and over 40,000 other global equities) please visit www.capitalcube.com.
J.B. Hunt Transport Services Inc.’s analysis versus peers uses the following peer-set: Old Dominion Freight Line (NASDAQ:ODFL), Werner Enterprises, Inc. (NASDAQ:WERN), Con Way Inc (NYSE:CNW), Knight Transportation (NYSE:KNX), Swift Transportation Co (NYSE:SWFT), Roadrunner Transportation Systems Inc (NYSE:RRTS) and Arkansas Best Corporation (NASDAQ:ABFS). The table below shows the preliminary results along with the recent trend for revenues, net income and returns.

Valuation Drivers
J.B. Hunt Transport Services Inc.’s current Price/Book of 8.2 is about median in its peer group. JBHT-US achieved a better operating performance than the median of its chosen peers (ROE of 46.8% compared to the peer median ROE of 14.5%) and the market still expects faster growth from it than from those peers (PE of 22.0 compared to peer median of 16.9).
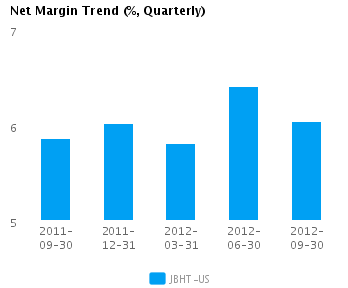
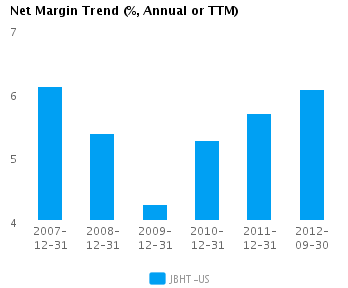
The company has a successful operating strategy with above median net profit margins of 6.1% (vs. peer median of 4.4%) and relatively high asset turns of 2.1x (vs. peer median of 1.7x). This suggests that the company has a dominant operating model relative to its peers. JBHT-US’s net margin continues to trend upward and is now over one standard deviation above its five-year average net margin of 5.3%.
Economic Moat
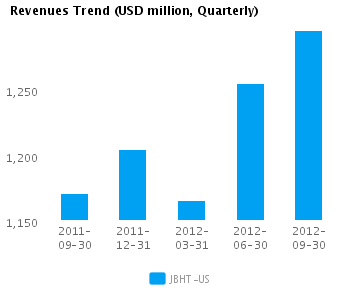
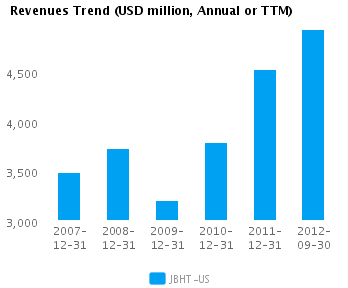
JBHT-US’s revenues have changed in-line with its peers (year-on-year change in revenues is 19.3%) but its earnings have lagged (annual reported earnings have changed by 28.7% compared to the peer median of 101.2%), implying that the company has less control over its costs relative to its peers. JBHT-US is currently converting every 1% of change in revenue into 1.5% change in annual reported earnings.
JBHT-US’s return on assets is above its peer median both in the current period (13.0% vs. peer median 7.6%) and also over the past five years (10.6% vs. peer median 6.1%). This performance suggests that the company’s relatively high operating returns are sustainable.
The company’s gross margin of 22.9% is around peer median suggesting that JBHT-US’s operations do not benefit from any differentiating pricing advantage. However, JBHT-US’s pre-tax margin is more than the peer median (9.8% compared to 7.3%) suggesting relatively tight control on operating costs.
Growth & Investment Strategy
JBHT-US has grown its revenues faster than its peers (6.6% vs. 2.9% respectively for the past three years). The market also sees relatively higher long-term growth prospects for the company, giving it a better than peer median PE ratio of 22.0. Overall, we classify the company’s growth prospects as superior relative to its peers.
JBHT-US’s annualized rate of change in capital of 4.2% over the past three years is higher than its peer median of 1.8%. This investment has generated an above peer median return on capital of 16.0% averaged over the same three years. Evidently, the relatively high capital investment was successful given the relatively strong growth in its returns.
Earnings Quality
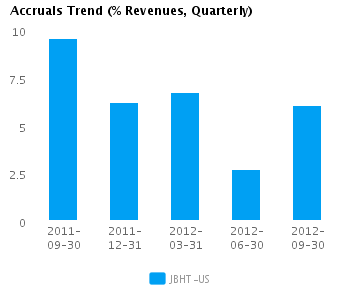
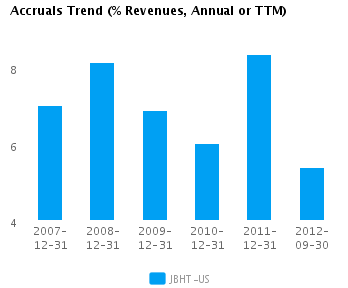
JBHT-US has reported relatively strong net income margin for the last twelve months (6.1% vs. peer median of 4.4%). This strong margin performance was accompanied by a level of accruals that was around peer median (5.4% vs. peer median of 6.2%) suggesting that the reported net income is supported by a reasonable level of accruals.
JBHT-US’s accruals over the last twelve months are positive suggesting a buildup of reserves. However, this level of accruals is also around the peer median and suggests the company is recording a proper level of reserves compared to its peers.
Trend Charts