Huntsman Corporation (NYSE:HUN) recently reported its preliminary financial results based on which we provide a unique peer-based analysis of the company. Our analysis is based on the company’s performance over the last twelve months (unless stated otherwise). For a more detailed analysis of this company (and over 40,000 other global equities) please visit www.capitalcube.com.
Huntsman Corp.’s analysis versus peers uses the following peer-set: The Dow Chemical Company (NYSE:DOW), Eastman Chemical Company (NYSE:EMN), Ashland Inc. (NYSE:ASH), Rockwood Holdings, Inc. (NYSE:ROC), Cytec Industries Inc (NYSE:CYT), PolyOne Corporation (NYSE:POL) and Kronos Worldwide, Inc. (NYSE:KRO). The table below shows the preliminary results along with the recent trend for revenues, net income and returns.
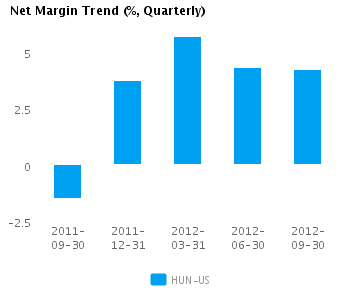
Quarterly (USD million)
2012-09-30
2012-06-30
2012-03-31
2011-12-31
2011-09-30
Revenues
2,741.0
2,914.0
2,913.0
2,632.0
2,976.0
Revenue Growth %
(5.9)
0.0
10.7
(11.6)
1.4
Net Income
116.0
126.0
167.0
99.0
(44.0)
Net Income Growth %
(7.9)
(24.6)
68.7
N/A
(138.6)
Net Margin %
4.2
4.3
5.7
3.8
(1.5)
ROE % (Annualized)
22.6
26.6
37.5
22.9
(9.0)
ROA % (Annualized)
5.3
5.7
7.6
4.5
(1.9)
Valuation Drivers
Huntsman Corp.’s current Price/Book of 1.7 is about median in its peer group. We classify HUN-US as Harvesting because of the market’s low expectations of growth (PE of 7.4 compared to peer median of 18.8) despite its relatively high returns (ROE of 25.3% compared to the peer median ROE of 18.5%).
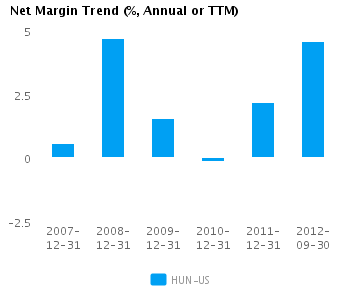
The company’s median net profit margins of 4.5% and relative asset efficiency (asset turns of 1.2x compared to peer median of 0.8x) give it some operating leverage. HUN-US’s net margin continues to trend upward and is now over one standard deviation above its five-year average net margin of 1.7%.
Economic Moat
HUN-US’s return on assets currently is around peer median (5.7% vs. peer median 4.9%) — similar to its returns over the past five years (2.1% vs. peer median 2.0%). This performance suggests that the company has no specific competitive advantages relative to its peers.
The company’s comparatively low gross margins of 21.8% versus peer median of 28.7% suggests that it has a non-differentiated strategy or is in a pricing constrained position. However, HUN-US’s pre-tax margin of 6.1% is around the peer median which, when combined with the gross margin, suggests lower operating costs relative to peers.
Growth & Investment Strategy
While HUN-US’s revenues growth has been above the peer median (3.2% vs. 1.8% respectively for the past three years), the stock’s PE ratio of 7.4 is less than the peer median. This implies that the company’s earnings are peaking and the market expects a decline in its growth expectations.
HUN-US’s annualized rate of change in capital of 0.7% over the past three years is less than its peer median of 7.6%. This below median investment level has also generated a less than peer median return on capital of 2.0% averaged over the same three years. This outcome suggests that the company has invested capital relatively poorly and now may be in maintenance mode.
Earnings Quality
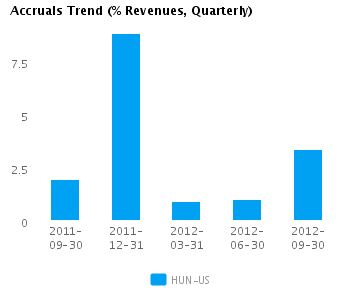
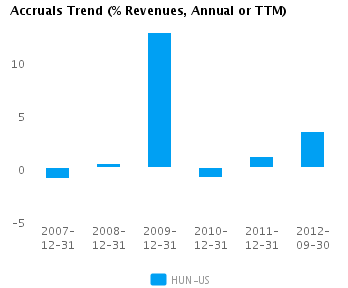
HUN-US’s net income margin for the last twelve months is around the peer median (4.5% vs. peer median of 5.1%). This average margin combined with a level of accruals that is around peer median (3.5% vs. peer median of 3.1%) suggests there possibly isn’t too much accrual movement flowing into the company’s reported earnings.
HUN-US’s accruals over the last twelve months are positive suggesting a buildup of reserves. However, this level of accruals is also around the peer median and suggests the company is recording a proper level of reserves compared to its peers.
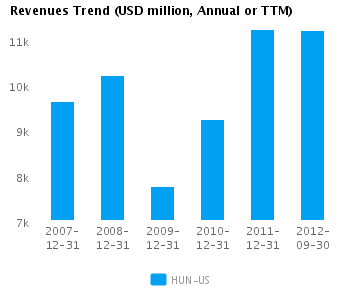
Trend Charts
Company Profile
Huntsman Corp. is a global manufacturer of differentiated organic and inorganic chemical products. The company’s products comprises of chemicals and formulations, which it markets to a diversified group of consumer and industrial customers. Its products are used in a wide range of applications which include adhesives, aerospace, automotive, construction products, durable and non-durable consumer products, electronics, medical, packaging, paints and coatings, power generation, refining, synthetic fiber, textile chemicals and dye industries. The company operates its business through five segments: Polyurethanes, Performance Products, Advanced Materials, Textile Effects and Pigments. The Polyurethanes segment manufactures and markets a broad range of polyurethane chemicals, including MDI products, PO, polyols, PG and TPU. The Performance Products segment is organized around three market areas: performance specialties, performance intermediates and maleic anhydride and licensing, and serves a wide variety of consumer and industrial end markets. The Advanced Materials segment manufactures and markets technologically advanced epoxy, acrylic and polyurethane-based polymer products. The Textile Effects segment provides market share for textile chemicals and dyes. The Pigments segment manufactures and markets titanium dioxide, which is a white pigment used to impart whiteness, brightness and opacity to products such as paints, plastics, paper, printing inks, fibers and ceramics. Huntsman was founded on October 19, 2004 and is headquartered in Salt Lake City, UT.
Disclaimer
The information presented in this report has been obtained from sources deemed to be reliable, but AnalytixInsight does not make any representation about the accuracy, completeness, or timeliness of this information. This report was produced by AnalytixInsight for informational purposes only and nothing contained herein should be construed as an offer to buy or sell or as a solicitation of an offer to buy or sell any security or derivative instrument. This report is current only as of the date that it was published and the opinions, estimates, ratings and other information may change without notice or publication. Past performance is no guarantee of future results. Prior to making an investment or other financial decision, please consult with your financial, legal and tax advisors. AnalytixInsight shall not be liable for any party’s use of this report. AnalytixInsight is not a broker-dealer and does not buy, sell, maintain a position, or make a market in any security referred to herein. One of the principal tenets for us at AnalytixInsight is that the best person to handle your finances is you. By your use of our services or by reading any our reports, you’re agreeing that you bear responsibility for your own investment research and investment decisions. You also agree that AnalytixInsight, its directors, its employees, and its agents will not be liable for any investment decision made or action taken by you and others based on news, information, opinion, or any other material generated by us and/or published through our services. For a complete copy of our disclaimer, please visit our website www.analytixinsight.com.
This article was originally written by abha.dawesar, and posted on CapitalCube.
Despite Joe Biden’s age, raging inflation, and his dismal 45% approval level…
I believe he will not only run again next year, but could win a 2nd Presidential term… and by a LANDSLIDE.
Along the way, I believe Biden could become one of the most powerful Presidents in history.
How is this all possible?
Well, it’s almost entirely because of a surprising July 25th “twist” that hardly anybody’s talking about right now.
In short, a powerful new economic force is quietly building behind Joe Biden… and I’m confident Biden can harness this force’s inevitable wave, carrying him to a LANDSLIDE re-election win.
The good news is, this powerful new force can help you make a lot of money even in a bear market. I believe it will make millions of Americans vastly wealthier.
The bad news is, this July 25th twist is also likely to make Biden and the progressives more powerful than ever. That means much bigger government. And it means it’s going to be harder than ever to hold onto any money you make.
Warren Buffett never mentions this but he is one of the first hedge fund managers who unlocked the secrets of successful stock market investing. He launched his hedge fund in 1956 with $105,100 in seed capital. Back then they weren’t called hedge funds, they were called “partnerships”. Warren Buffett took 25% of all returns in excess of 6 percent.
For example S&P 500 Index returned 43.4% in 1958. If Warren Buffett’s hedge fund didn’t generate any outperformance (i.e. secretly invested like a closet index fund), Warren Buffett would have pocketed a quarter of the 37.4% excess return. That would have been 9.35% in hedge fund “fees”.
Actually Warren Buffett failed to beat the S&P 500 Index in 1958, returned only 40.9% and pocketed 8.7 percentage of it as “fees”. His investors didn’t mind that he underperformed the market in 1958 because he beat the market by a large margin in 1957. That year Buffett’s hedge fund returned 10.4% and Buffett took only 1.1 percentage points of that as “fees”. S&P 500 Index lost 10.8% in 1957, so Buffett’s investors actually thrilled to beat the market by 20.1 percentage points in 1957.
Between 1957 and 1966 Warren Buffett’s hedge fund returned 23.5% annually after deducting Warren Buffett’s 5.5 percentage point annual fees. S&P 500 Index generated an average annual compounded return of only 9.2% during the same 10-year period. An investor who invested $10,000 in Warren Buffett’s hedge fund at the beginning of 1957 saw his capital turn into $103,000 before fees and $64,100 after fees (this means Warren Buffett made more than $36,000 in fees from this investor).
As you can guess, Warren Buffett’s #1 wealth building strategy is to generate high returns in the 20% to 30% range.
We see several investors trying to strike it rich in options market by risking their entire savings. You can get rich by returning 20% per year and compounding that for several years. Warren Buffett has been investing and compounding for at least 65 years.
So, how did Warren Buffett manage to generate high returns and beat the market?
In a free sample issue of our monthly newsletter we analyzed Warren Buffett’s stock picks covering the 1999-2017 period and identified the best performing stocks in Warren Buffett’s portfolio. This is basically a recipe to generate better returns than Warren Buffett is achieving himself.
You can enter your email below to get our FREE report. In the same report you can also find a detailed bonus biotech stock pick that we expect to return more than 50% within 12-24 months. We initially share this idea in October 2018 and the stock already returned more than 150%. We still like this investment.
Free Report Reveals
Warren Buffet's Secret Recipe
Our Price: $199FREE
We may use your email to send marketing emails about our services. Click here to read our privacy policy.