Worthington Industries, Inc. (NYSE:WOR) recently reported its preliminary financial results based on which we provide a unique peer-based analysis of the company. Our analysis is based on the company’s performance over the last twelve months (unless stated otherwise). For a more detailed analysis of this company (and over 40,000 other global equities) please visit www.capitalcube.com.
Worthington Industries Inc.’s analysis versus peers uses the following peer-set: Nucor Corporation (NYSE:NUE), Reliance Steel & Aluminum (NYSE:RS), United States Steel Corporation (NYSE:X), Carpenter Technology Corporation (NYSE:CRS), Steel Dynamics, Inc. (NASDAQ:STLD), Commercial Metals Company (NYSE:CMC), Schnitzer Steel Industries, Inc. (NASDAQ:SCHN) and AK Steel Holding Corporation (NYSE:AKS). The table below shows the preliminary results along with the recent trend for revenues, net income and returns.
Valuation Drivers
Worthington Industries Inc.’s current Price/Book of 2.1 is about median in its peer group. WOR-US’s operating performance is higher than the median of its chosen peers (ROE of 17.4% compared to the peer median ROE of 7.1%) but the market does not seem to expect higher growth relative to peers (PE of 12.6 compared to peer median of 15.6) but simply to maintain its relatively high rates of return.
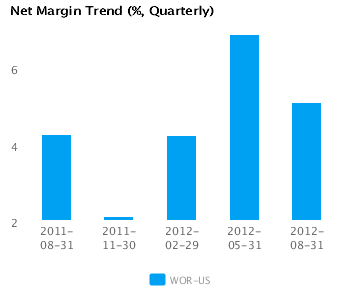
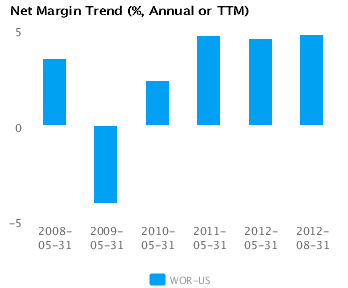
The company attempts to achieve high profit margins (currently 4.8% vs. peer median of 2.1%) through differentiated products. It currently operates with peer median asset turns of 1.5x. WOR-US’s net margin is its highest relative to the last four years and compares to a low of -4.1% in 2009.
Economic Moat
Changes in the company’s annual top line and earnings (3.8% and 0.5% respectively) generally lag its peers. This implies a lack of strategic focus and/or inability to execute. We view such companies as laggards relative to peers.
WOR-US’s current return on assets is better than its peer median (7.2% vs. peer median 3.5%) but this contrasts with its less than peer median return on assets over the past five years (3.2% vs. peer median 4.4%). This performance suggests that the company has improved its operations relative to peers.
The company’s comparatively healthy gross margin of 16.2% versus peer median of 11.2% suggests that it has a differentiated strategy with pricing advantages. Further, WOR-US’s bottom-line operating performance is better than peer median (pre-tax margins of 4.6% compared to peer median 3.1%) suggesting relatively tight control on operating costs.
Growth & Investment Strategy
While WOR-US’s revenues have grown faster than the peer median (-1.2% vs. -2.3% respectively for the past three years), the market gives the stock an about peer median PE ratio of 12.6. This suggests that the market has some questions about the company’s long-term strategy.
WOR-US’s annualized rate of change in capital of 9.2% over the past three years is higher than its peer median of 2.1%. This investment has generated an above peer median return on capital of 8.7% averaged over the same three years. Evidently, the relatively high capital investment was successful given the relatively strong growth in its returns.
Earnings Quality
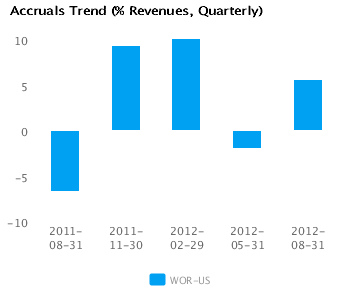
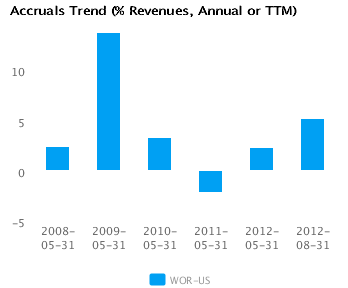
WOR-US has reported relatively strong net income margin for the last twelve months (4.8% vs. peer median of 2.1%). This margin performance combined with relatively high accruals (5.2% vs. peer median of 3.6%) suggests possible conservative accounting and an understatement of its reported net income.
WOR-US’s accruals over the last twelve months are positive suggesting a buildup of reserves. In addition, the level of accrual is greater than the peer median — which suggests a relatively strong buildup in reserves compared to its peers.
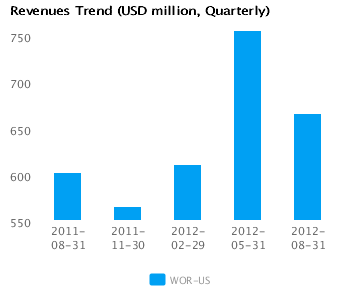
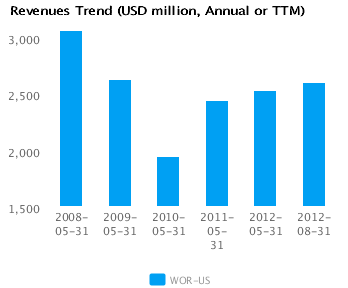
Trend Charts
Company Profile
Worthington Industries, Inc. is a diversified metals processing company, focused on value-added steel processing and manufactured metal products. Its manufactured metal products include: pressure cylinder products such as propane, oxygen and helium tanks, hand torches, refrigerant and industrial cylinders, camping cylinders, scuba tanks, compressed natural gas cylinders and helium balloon kits; engineered cabs and operator stations and cab components; framing systems for mid-rise buildings; steel pallets and racks; and, through joint ventures, suspension grid systems for concealed and lay-in panel ceilings; laser welded blanks; light gauge steel framing for commercial and residential construction; and current and past model automotive service stampings. The company operates into four reportable business segments: Steel Processing, Pressure Cylinders, Engineered Cabs and, on an historical basis, Metal Framing. The Steel Processing segment consists of the Worthington Steel business unit, and includes Precision Specialty Metals, Inc. This operating segment processing capabilities include pickling; slitting; cold reducing; hot-dipped galvanizing; hydrogen annealing; cutting-to-length; tension leveling; edging; non-metallic coating, including dry lubrication, acrylic and paint; and configured blanking. Worthington Steel sells to customers principally in the automotive, construction, lawn and garden, hardware, furniture, office equipment, electrical control, tubing, leisure and recreation, appliance, agricultural, HVAC, container and aerospace markets. The Pressure Cylinders segment consists of the Worthington Cylinders business unit and WNCL, a consolidated joint venture based in India that manufactures high-pressure, seamless steel cylinders for compressed natural gas storage in motor vehicles as well as cylinders for compressed industrial gases. Pressure Cylinders also manufactures and sells filled and unfilled pressure cylinders and various accessories for a diversified number of end-use market applications. The Engineered Cabs segment designs and manufactures custom-engineered open and closed cabs and operator stations for a wide range of heavy mobile equipment in a range of industries. Engineered Cabs also manufactures other specialty weldments, kits, accessories, and cab components. The Metal Framing segment consists of the Dietrich Metal Framing business unit. The company was founded by John H. McConnell in 1955 and is headquartered in Columbus, OH.
Disclaimer
The information presented in this report has been obtained from sources deemed to be reliable, but AnalytixInsight does not make any representation about the accuracy, completeness, or timeliness of this information. This report was produced by AnalytixInsight for informational purposes only and nothing contained herein should be construed as an offer to buy or sell or as a solicitation of an offer to buy or sell any security or derivative instrument. This report is current only as of the date that it was published and the opinions, estimates, ratings and other information may change without notice or publication. Past performance is no guarantee of future results. Prior to making an investment or other financial decision, please consult with your financial, legal and tax advisors. AnalytixInsight shall not be liable for any party’s use of this report. AnalytixInsight is not a broker-dealer and does not buy, sell, maintain a position, or make a market in any security referred to herein. One of the principal tenets for us at AnalytixInsight is that the best person to handle your finances is you. By your use of our services or by reading any our reports, you’re agreeing that you bear responsibility for your own investment research and investment decisions. You also agree that AnalytixInsight, its directors, its employees, and its agents will not be liable for any investment decision made or action taken by you and others based on news, information, opinion, or any other material generated by us and/or published through our services. For a complete copy of our disclaimer, please visit our website www.analytixinsight.com.
This article was originally written by abha.dawesar, and posted on CapitalCube.
Before you make your next trade, you’ll want to know this.
Insider Monkey keeps track of top-rated corporate insiders and best performing hedge funds and the stocks they buy on a daily basis.
Our team has identified the five stocks that insiders and hedge funds are quietly accumulating before the broader market catches on… and none of the usual big name stocks were on the list.
They believe these five stocks are the five best companies for investors to buy now…
Warren Buffett never mentions this but he is one of the first hedge fund managers who unlocked the secrets of successful stock market investing. He launched his hedge fund in 1956 with $105,100 in seed capital. Back then they weren’t called hedge funds, they were called “partnerships”. Warren Buffett took 25% of all returns in excess of 6 percent.
For example S&P 500 Index returned 43.4% in 1958. If Warren Buffett’s hedge fund didn’t generate any outperformance (i.e. secretly invested like a closet index fund), Warren Buffett would have pocketed a quarter of the 37.4% excess return. That would have been 9.35% in hedge fund “fees”.
Actually Warren Buffett failed to beat the S&P 500 Index in 1958, returned only 40.9% and pocketed 8.7 percentage of it as “fees”. His investors didn’t mind that he underperformed the market in 1958 because he beat the market by a large margin in 1957. That year Buffett’s hedge fund returned 10.4% and Buffett took only 1.1 percentage points of that as “fees”. S&P 500 Index lost 10.8% in 1957, so Buffett’s investors actually thrilled to beat the market by 20.1 percentage points in 1957.
Between 1957 and 1966 Warren Buffett’s hedge fund returned 23.5% annually after deducting Warren Buffett’s 5.5 percentage point annual fees. S&P 500 Index generated an average annual compounded return of only 9.2% during the same 10-year period. An investor who invested $10,000 in Warren Buffett’s hedge fund at the beginning of 1957 saw his capital turn into $103,000 before fees and $64,100 after fees (this means Warren Buffett made more than $36,000 in fees from this investor).
As you can guess, Warren Buffett’s #1 wealth building strategy is to generate high returns in the 20% to 30% range.
We see several investors trying to strike it rich in options market by risking their entire savings. You can get rich by returning 20% per year and compounding that for several years. Warren Buffett has been investing and compounding for at least 65 years.
So, how did Warren Buffett manage to generate high returns and beat the market?
In a free sample issue of our monthly newsletter we analyzed Warren Buffett’s stock picks covering the 1999-2017 period and identified the best performing stocks in Warren Buffett’s portfolio. This is basically a recipe to generate better returns than Warren Buffett is achieving himself.
You can enter your email below to get our FREE report. In the same report you can also find a detailed bonus biotech stock pick that we expect to return more than 50% within 12-24 months. We initially share this idea in October 2018 and the stock already returned more than 150%. We still like this investment.
Free Report Reveals
Warren Buffet's Secret Recipe
Our Price: $199FREE
We may use your email to send marketing emails about our services. Click here to read our privacy policy.