Big Lots, Inc. (NYSE:BIG) recently reported its preliminary financial results based on which we provide a unique peer-based analysis of the company. Our analysis is based on the company’s performance over the last twelve months (unless stated otherwise). For a more detailed analysis of this company (and over 40,000 other global equities) please visit www.capitalcube.com.

Big Lots Inc.’s analysis versus peers uses the following peer-set: Costco Wholesale Corporation (NASDAQ:COST), Target Corporation (NYSE:TGT), Dollar General Corp. (NYSE:DG), Dollar Tree, Inc. (NASDAQ:DLTR), Family Dollar Stores, Inc. (NYSE:FDO) and Fred’s, Inc. (NASDAQ:FRED). The table below shows the preliminary results along with the recent trend for revenues, net income and returns.
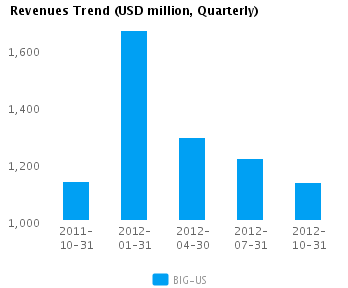
| Quarterly (USD million) | 2012-10-31 | 2012-07-31 | 2012-04-30 | 2012-01-31 | 2011-10-31 |
|---|---|---|---|---|---|
| Revenues | 1,134.2 | 1,218.0 | 1,294.5 | 1,669.6 | 1,138.3 |
| Revenue Growth % | (6.9) | (5.9) | (22.5) | 46.7 | (2.5) |
| Net Income | (6.0) | 22.1 | 40.8 | 114.7 | 4.2 |
| Net Income Growth % | (127.1) | (45.8) | (64.5) | 2,605.7 | (88.1) |
| Net Margin % | (0.5) | 1.8 | 3.2 | 6.9 | 0.4 |
| ROE % (Annualized) | (3.6) | 11.8 | 20.0 | 58.3 | 2.2 |
| ROA % (Annualized) | (1.3) | 5.2 | 9.5 | 24.7 | 1.0 |
Valuation Drivers
Big Lots Inc. currently trades at a higher Price/Book ratio (2.8) than its peer median (2.0). We classify BIG-US as Harvesting because of the market’s low expectations of growth (PE of 11.8 compared to peer median of 16.5) despite its relatively high returns (ROE of 24.8% compared to the peer median ROE of 19.4%).
The company’s profit margins are below peer median (currently 3.2% vs. peer median of 4.2%) while its asset efficiency is about median (asset turns of 2.6x compared to peer median of 2.8x). BIG-US’s net margin is its lowest relative to the last five years and compares to a high of 4.5% in 2011.
Economic Moat
Changes in the company’s annual top line and earnings (5.0% and -6.9% respectively) generally lag its peers. This implies a lack of strategic focus and/or inability to execute. We view such companies as laggards relative to peers.
BIG-US’s current return on assets is around peer median (8.5% vs. peer median 8.5%). This contrasts with its higher than peer median return on assets over the past five years (11.4% vs. peer median 6.1%), suggesting that the company’s relative operating performance has declined.
The company’s gross margin of 39.4% is around peer median suggesting that BIG-US’s operations do not benefit from any differentiating pricing advantage. In addition, BIG-US’s pre-tax margin of 5.4% is also around the peer median suggesting no operating cost advantage relative to peers.
Growth & Investment Strategy
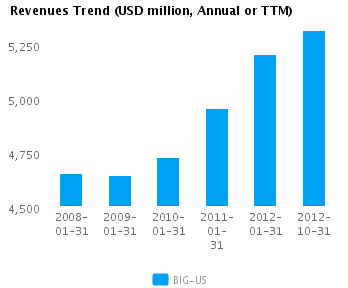
BIG-US’s revenues have grown more slowly than the peer median over the last few years (3.8% vs. 8.0% respectively for the past three years) and the stock price’s relatively low PE ratio of 11.8 implies relatively low future growth as well. Overall, we view the company’s growth expectations as substandard relative to its peers.
BIG-US’s annualized rate of change in capital of 2.0% over the past three years is around the same as its peer median of 2.0%. This investment has generated a better than peer median return on capital of 22.3% averaged over the same three years. The greater than peer median rate of return suggest that the company may be under investing in growth.
Earnings Quality
BIG-US reported relatively weak net income margins for the last twelve months (3.2% vs. peer median of 4.2%). However, the company booked a level of accruals that is around peer median (1.7% vs. peer median of 1.4%) for the same period, suggesting that its reported net income is supported by a reasonable level of accruals.
BIG-US’s accruals over the last twelve months are around zero. This level is also around the peer median suggesting a proper level of reserves.
Trend Charts


Company Profile
Disclaimer
This article was originally written by abha.dawesar, and posted on CapitalCube.


