Earnings Analysis: Alcoa Inc. (NYSE:AA)

Alcoa Inc. (NYSE:AA) recently reported its preliminary financial results based on which we provide a unique peer-based analysis of the company. Our analysis is based on the company’s performance over the last twelve months (unless stated otherwise). For a more detailed analysis of this company (and over 40,000 other global equities) please visitwww.capitalcube.com.

Alcoa Inc.’s analysis versus peers uses the following peer-set: NORSK HYDRO A.S.A NOK1.098 (LON:NHY), Hindalco Industries Ltd. (500440-IN), National Aluminum Co. Ltd. (532234-IN), Alumina Limited (NYSE:AWC), Aluminum Corp. of China Limited (NYSE:ACH) and Kaiser Aluminum Corp. (NASDAQ:KALU). The table below shows the preliminary results along with the recent trend for revenues, net income and returns.

Earnings Analysis: Alcoa Inc. (NYSE:AA)

Valuation Drivers

Alcoa Inc.’s current Price/Book of 0.7 is about median in its peer group. The market expects AA-US to grow faster than the median of its chosen peers (PE of 127.5 compared to peer median of 19.3) and to improve its current ROE of -1.7% which is below its peer median of 1.5%. Thus, the market seems to expect a turnaround in AA-US’s current performance.

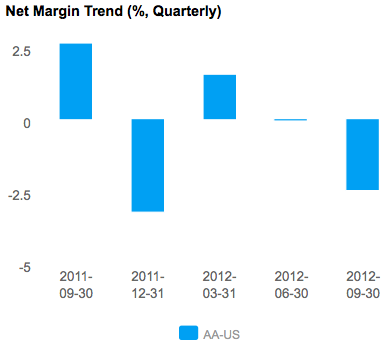
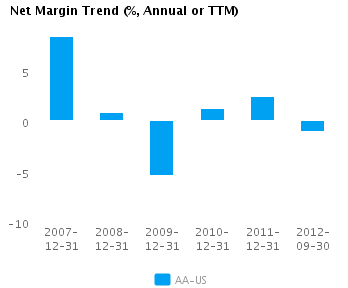
The company’s profit margins are below peer median (currently -1.0% vs. peer median of 1.6%) while its asset efficiency is about median (asset turns of 0.6x compared to peer median of 0.7x). AA-US’s net margin is less than (but within one standard deviation of) its five-year average net margin of 1.5%.

Economic Moat

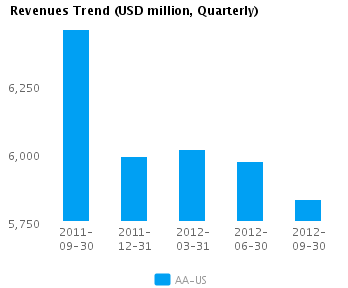
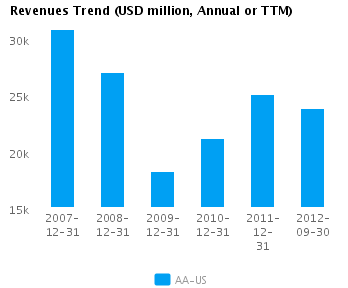
Changes in the company’s revenues are in-line with its peers (annual revenue changed by 18.6%) but its earnings performance has been better — its annual earnings changed by 134.0% compared to the peer median of 78.0%, implying that it has better cost control relative to its peers. AA-US currently converts every 1% of change in revenue into 7.2% of change in annual reported earnings.

AA-US’s return on assets is less than its peer median currently (-0.6% vs. peer median 1.3%). It has also had less than peer median returns on assets over the past five years (1.4% vs. peer median 2.9%). This performance suggests that the company has persistent operating challenges relative to peers.

The company’s gross margin of 12.8% is around peer median suggesting that AA-US’s operations do not benefit from any differentiating pricing advantage. In addition, AA-US’s pre-tax margin is less than the peer median (-1.3% compared to 2.8%) suggesting relatively high operating costs.

Growth & Investment Strategy

While AA-US’s revenues have increased more slowly than the peer median (-2.4% vs. 4.1% respectively for the past three years), the market currently gives the company a higher than peer median PE ratio of 127.5. The stock price may be factoring in some sort of a strategic play.

AA-US’s annualized rate of change in capital of 1.3% over the past three years is less than its peer median of 7.7%. This below median investment level has also generated a less than peer median return on capital of -0.2% averaged over the same three years. This outcome suggests that the company has invested capital relatively poorly and now may be in maintenance mode.

Earnings Quality

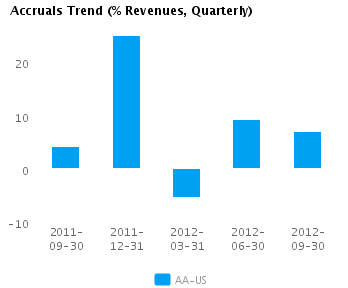
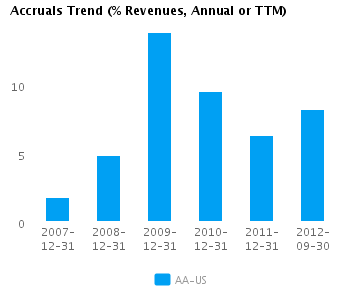
AA-US reported relatively weak net income margins for the last twelve months (-1.0% vs. peer median of 1.6%). This weak margin performance and relatively conservative accrual policy (8.2% vs. peer median of 2.4%) suggest the company might likely be understating its net income, possibly to the extent that there might even be some sandbagging of the reported net income numbers.

AA-US’s accruals over the last twelve months are positive suggesting a buildup of reserves. In addition, the level of accrual is greater than the peer median — which suggests a relatively strong buildup in reserves compared to its peers.

Trend Charts

Graph of Revenues Trend for Alcoa Inc. (NYSE:AA)
Graph of Net Margin Trend for Alcoa Inc. (NYSE:AA)
Graph of Accruals Trend (% revenues, Quarterly) for Alcoa Inc. (NYSE:AA)
Graph of Accruals Trend (% revenues, Annual or TTM) for Alcoa Inc. (NYSE:AA)

Company Profile

Alcoa, Inc. is engaged in the production and management of primary aluminum, fabricated aluminum, and alumina. Its products are used worldwide in aircraft, automobiles, commercial transportation, packaging, oil and gas, defense, and industrial applications. The company operates through four reportable business segments: Alumina, Primary Metals, Flat-Rolled Products and Engineered Products and Solutions. The Alumina segment consists of Alcoa’s worldwide alumina system, including the mining of bauxite, which is then refined into alumina. Alumina is mainly sold directly to internal and external smelter customers worldwide through agents, alumina traders, and distributors. The Primary Metals segment comprises of Alcoa’s worldwide smelter system that receives alumina, mostly from the Alumina segment, and produces primary aluminum used by Alcoa’s fabricating businesses, as well as sold to external customers, aluminum traders, and commodity markets. The Flat-Rolled Products segment is involved in the production and sale of aluminum plate, sheet and foil. It includes rigid container sheet, which is sold directly to customers in the packaging and consumer market. The segment also includes sheet and plate used in the transportation, building and construction and distribution markets. The Engineered Products and Solutions segment is involved in the production and sale of titanium, aluminum and super alloy investment castings, hard alloy extrusions, forgings and fasteners, aluminum wheels, integrated aluminum structural systems and architectural extrusions. These products serve the aerospace, automotive, building and construction, commercial transportation, power generation and defense markets. The company was founded on October 1, 1888 by Charles Martin Hall and is headquartered in New York, NY.

Disclaimer

The information presented in this report has been obtained from sources deemed to be reliable, but AnalytixInsight does not make any representation about the accuracy, completeness, or timeliness of this information. This report was produced by AnalytixInsight for informational purposes only and nothing contained herein should be construed as an offer to buy or sell or as a solicitation of an offer to buy or sell any security or derivative instrument. This report is current only as of the date that it was published and the opinions, estimates, ratings and other information may change without notice or publication. Past performance is no guarantee of future results. Prior to making an investment or other financial decision, please consult with your financial, legal and tax advisors. AnalytixInsight shall not be liable for any party’s use of this report. AnalytixInsight is not a broker-dealer and does not buy, sell, maintain a position, or make a market in any security referred to herein. One of the principal tenets for us at AnalytixInsight is that the best person to handle your finances is you. By your use of our services or by reading any our reports, you’re agreeing that you bear responsibility for your own investment research and investment decisions. You also agree that AnalytixInsight, its directors, its employees, and its agents will not be liable for any investment decision made or action taken by you and others based on news, information, opinion, or any other material generated by us and/or published through our services. For a complete copy of our disclaimer, please visit our website www.analytixinsight.com.
This article was originally written by abha.dawesar, and posted on CapitalCube.