3M Co (NYSE:MMM) recently reported its preliminary financial results based on which we provide a unique peer-based analysis of the company. Our analysis is based on the company’s performance over the last twelve months (unless stated otherwise). For a more detailed analysis of this company (and over 40,000 other global equities) please visit www.capitalcube.com.

3M Co.’s analysis versus peers uses the following peer-set: General Electric Company (NYSE:GE), Johnson & Johnson (NYSE:JNJ), Honeywell International Inc. (NYSE:HON), Danaher Corporation (NYSE:DHR), Illinois Tool Works Inc. (NYSE:ITW) and Tyco International Ltd. (NYSE:TYC). The table below shows the preliminary results along with the recent trend for revenues, net income and returns. CapitalCube published its Earnings Analysis on Honeywell International Inc. (HON) on Tuesday.
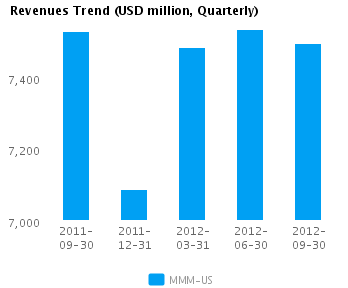
| Quarterly (USD million) | 2012-09-30 | 2012-06-30 | 2012-03-31 | 2011-12-31 | 2011-09-30 |
|---|---|---|---|---|---|
| Revenues | 7,497.0 | 7,534.0 | 7,486.0 | 7,089.0 | 7,531.0 |
| Revenue Growth % | (0.5) | 0.6 | 5.6 | (5.9) | (1.9) |
| Net Income | 1,161.0 | 1,167.0 | 1,125.0 | 954.0 | 1,088.0 |
| Net Income Growth % | (0.5) | 3.7 | 17.9 | (12.3) | (6.2) |
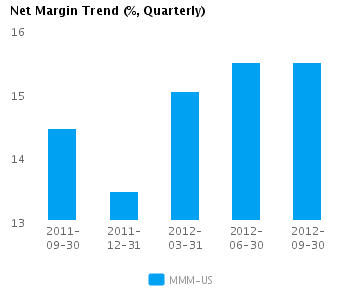
| Net Margin % | 15.5 | 15.5 | 15.0 | 13.5 | 14.4 |
| ROE % (Annualized) | 26.9 | 28.6 | 28.5 | 23.6 | 25.4 |
| ROA % (Annualized) | 13.7 | 14.3 | 14.1 | 12.0 | 13.5 |
Valuation Drivers
3M Co.’s current Price/Book of 3.5 is about median in its peer group. MMM-US’s operating performance is higher than the median of its chosen peers (ROE of 25.1% compared to the peer median ROE of 13.8%) but the market does not seem to expect higher growth relative to peers (PE of 14.8 compared to peer median of 16.0) but simply to maintain its relatively high rates of return.
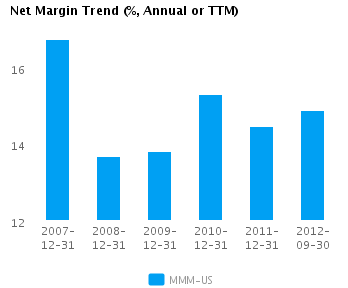
The company has a successful operating strategy with above median net profit margins of 14.9% (vs. peer median of 10.9%) and relatively high asset turns of 0.9x (vs. peer median of 0.7x). This suggests that the company has a dominant operating model relative to its peers. MMM-US’s net margin is similar to its five-year average net margin of 14.8%.
Economic Moat
MMM-US’s revenues have changed in-line with its peers (year-on-year change in revenues is 11.1%) but its earnings have lagged (annual reported earnings have changed by 4.8% compared to the peer median of 7.9%), implying that the company has less control over its costs relative to its peers. MMM-US is currently converting every 1% of change in revenue into 0.4% change in annual reported earnings.
MMM-US’s return on assets is above its peer median both in the current period (13.2% vs. peer median 7.1%) and also over the past five years (14.4% vs. peer median 7.5%). This performance suggests that the company’s relatively high operating returns are sustainable.
The company’s gross margin of 50.8% is around peer median suggesting that MMM-US’s operations do not benefit from any differentiating pricing advantage. However, MMM-US’s pre-tax margin is more than the peer median (21.2% compared to 15.2%) suggesting relatively tight control on operating costs.
Growth & Investment Strategy
While MMM-US’s revenues have grown faster than the peer median (5.4% vs. 0.7% respectively for the past three years), the market gives the stock an about peer median PE ratio of 14.8. This suggests that the market has some questions about the company’s long-term strategy.
MMM-US’s annualized rate of change in capital of 7.5% over the past three years is around the same as its peer median of 7.3%. This investment has generated a better than peer median return on capital of 19.7% averaged over the same three years. The greater than peer median rate of return suggest that the company may be under investing in growth.
Earnings Quality
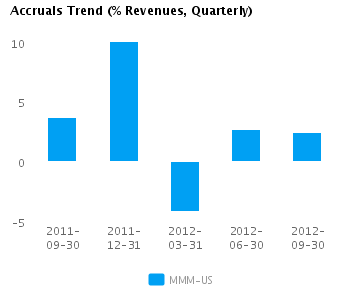
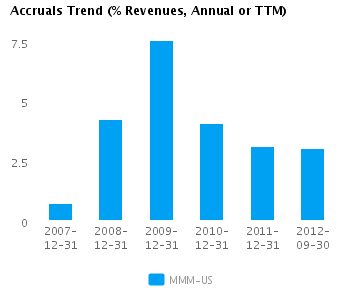
MMM-US has reported relatively strong net income margin for the last twelve months (14.9% vs. peer median of 10.9%). This margin performance combined with relatively low accruals (3.0% vs. peer median of 7.4%) suggests possible aggressive accounting and an overstatement of its reported net income.
MMM-US’s accruals over the last twelve months are positive suggesting a buildup of reserves. But this level of accruals is less than the peer median — which suggests that while the company is building reserves, it is doing so in a relatively modest manner compared to its peers.
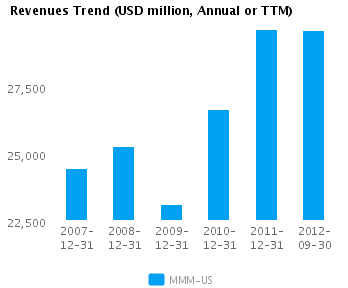
Trend Charts