Are you tired of listening to all the billionaires who made their fortune taking enormous gambles tell you that you are too dumb to accomplish what they did? Instead, you better just buy index funds, never sell, and be thankful you still have the shirt on your back. Not so fast. You can beat the market, and it is easier than you think. You don’t have to bet the bank on a single firm, short CDS, or make massive currency gambles. You can beat the market while holding a diversified basket of stocks and even index funds. Your emotional and fearful neighbor may not be able to pull this off, but you can because you have an objective game plan, a guide that eliminates fear and greed and keeps you in trend with the market. I will highlight the first of three indicators that will guide you to consistently beat the market.
Image: Cliffs Natural Resources Inc (NYSE:CLF)

Diversify, But DON’T Buy and Hold
Diversification is a very important investing tool and should never be abandoned by the average investor. You can make some strategic bets, and over-diversifying adds undue expenses, but some implementation of this principle is sound investing advice. What is not good investing advice is the principle of buy and hold. The fact that the market is little changed during the last 13 years ought to exemplify this idea. Some investors have confused this principle with abandoning stocks all together in favor of the perceived safety of bonds and CERTAINTY of low returns. Don’t make this foolish mistake. Instead, the best way to beat the market is to own a diverse basket of stocks during cyclical bull markets and opt for cash or U.S. Treasuries during cyclical bear markets.
This is not day trading as these cycles can last anywhere from nine months to three years or more. You can go upwards of several years without making a single trade and still beat the market by a wide margin over the course of thirty years or more. The market will exhibit its usual zigs and zags, but you will benefit from getting most of the boom and missing most of the bust. And what is the magic elixir? Over a three part series I will show you three objective indicators that anyone can follow to ensure they are positioned to profit from the booms and preserve capital during the busts. Use these to create an investment tree that makes the investment decisions for you.
Needlessly to say, when all three are favorable it bodes well to be fully allocated to equities and when all three are flashing red flags it is time to batten down the hatches and think capital preservation. Make a plan based on your risk tolerance for the other combinations as the three indicators won’t always give the same signal in unison.
Follow High-Yield Bonds
High-yield bonds have an uncanny ability to lead the stock market. It makes sense given their position on the risk spectrum between safer corporate bond alternatives and equities. The iShares iBoxx High Yield Corp Bond ETF (NYSEMKT:HYG) is the largest U.S. high-yield bond ETF with over $15 billion in assets under management. The fund owns more than 700 issues with a weighted average maturity of just over six years. High yield bonds are very cyclical and returns boom and bust just like equities.
High-yield bonds enter bear markets before equities. This reflects tendencies for credit to incorporate the changing interest rate landscape much more swiftly than equities, which tend to overlook this in favor of near-term earnings. High-yield default risks will also start to tick up noticeably before major earnings revisions flow though to large-cap equities. The result is that high-yield can give a 6-12 month lead time to the direction of the U.S. equity market.
So what exactly should investors focus on? Watch for the rolling year-to-year change in the total return to fall below +2% for the second time in the cycle. Remember that total return includes coupon payments and price changes. Let’s give an example below. HYG returned a level below the +2% threshold for the one-year period between 09/30/2010 and 09/30/2011. However, this was only the first time since the Global Financial Crisis that returns dipped below +2%. During the midst of this large market correction, following high-yield bonds blindly would have caused an investor to exit the S&P 500 around 1,100 and miss the subsequent 40% rally.

HYG Total Return Price data by YCharts
It is imperative to wait for the second pullback in year-to-year total returns on high-yield bonds to drop below the +2% threshold. The first pullback reflects a combination of ebbing market emotions along with concerns that the initial rally can’t be sustained. This is usually when the bear market forecasters are seeing unusually large amounts of TV time. This is not the end of the cycle.
Below are some historical examples:
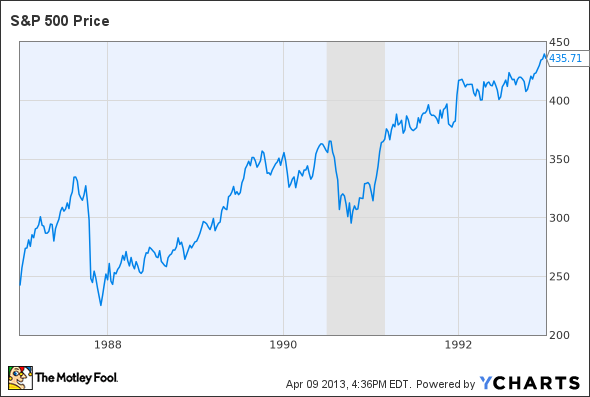
Following Black Monday in 1987, the indicator fell below the threshold for the first time. Not a good time to sell. The market would see new highs before the high-yield total return would fall below +2% again in late 1989. This was the time to sell stocks–ahead of the ensuing recession and bear market in equities.
Another first time signal was given in 1995, but the real warning wouldn’t come until mid-1998. Notice that this was 18 months prior to the market peak. The next bear market warning would come in late 2007, but on this occasion the lead time was very minimal. The fact that this indicator leads is unquestioned, but investors should be aware that the window can vary by up to twelve months. This is why an objectionable investment plan is required to ensure one stays the course amid the bull and bear prognostications.
So where are we today? We have already had the first “scare” in 2011 that washed out sentiment and set the stage for major indices to reach new all-time highs this year. The chart below shows the 1-year total return for high-yield bonds is currently at +12% and well clear of any danger signs. When this falls to +2%, it will indicate a big red flag for U.S. equities.

HYG Total Return Price data by YCharts
Stocks to Avoid
Given that we are approaching the later innings in this cyclical rally, individual equity decisions should reflect this outlook. Material stocks have been crushed lately, but I would stay clear of the entire space until after the next bear market. It would probably be prudent to again ignore Barron’s recent recommendation on Cliffs Natural Resources Inc (NYSE:CLF). The iron-ore miner has seen its stock routed to the tune of 70% over the last year as high fixed costs and collapsing iron-ore spot prices weigh down earnings. The stock is cheap, but fundamentals are deteriorating and it is a classic value trap. There may be long-term upside, but there is also plenty of near-term downside risk as well. Remember, buy and hold is not the key to beating the market. It is better to wait for improving fundamentals and own Cliffs Natural Resources Inc (NYSE:CLF)’s after the next bear market, not before.
The same thing goes for the iron-ore leader Vale SA (ADR) (NYSE:VALE). The low cost world leader in iron-ore mining won’t exhibit the same earnings volatility as Cliffs Natural Resources Inc (NYSE:CLF), but is still subject to earning a profit by being a price taker. The high trailing dividend yield above 5% is artificial given the irregularity of payments. The company did approve $4 billion in minimum distributions which equates to a yield above 4%. But don’t be fooled by the dividend yield, the company faces weak earnings prospects and enormous stock downside during bear markets.
The Foolish Bottom Line
I have highlighted the importance of following high-yield bonds in gauging the prospects for the U.S. equity market. It is one of three simple tools the average investor can use to generate a long track record of market-beating performance. Right now it is clearly indicating more upside in this mature bull market. Stay the course with equities, but be cautious on risky sectors such as materials that are prone to big drawdowns during bear markets. The next blog will highlight another tried and true indicator that is also supportive of continued equity upside–the yield curve.
Justin Carley has no position in any stocks mentioned. The Motley Fool has no position in any of the stocks mentioned.
Related ticker: Cliffs Natural Resources Inc (NYSE:CLF)


