Every now and then, seemingly unjustified pullbacks can gift bold investors with significant price reductions, increased yields, and more favorable long term returns. Recently, European oil stocks have suffered amid renewed fears that austerity’s harsh economic effects will linger. But when quality companies with inelastic products and global demand suffer major declines, they can often offer long-term value investors an ideal entry point.

Poshly Refined
Over the last 45 days, BP plc (ADR) (NYSE:BP) shares have slid 10%. But the majority of BP plc (ADR) (NYSE:BP) analysts have held firm on their outlook for fiscal 2013 and 2014.
This London-based company has put the Deepwater Horizon (DH) tragedy largely behind it, and is poised for a solid future. Fifteen projects are scheduled for completion in the coming two years. Two more projects were started in Q4 of 2012, for a total of five new projects last year.

In addition, four new projects are already underway for 2013 in Australia, Azerbaijan, Angola, and the Gulf of Mexico. BP is also the largest leaseholder in the Gulf of Mexico, with more than 700 contracts.
Since the Deepwater Horizon, BP plc (ADR) (NYSE:BP) has a total cumulative net charge of $42.3 billion for damages. This incident has spurred BP to refocus its business by divesting non-core assets. Since 2010, BP has divested a total of $37.8 billion.
“We will continue to see the impact of this reshaping work in our reported results in 2013,” said CEO Bob Dudley. “By 2014, I expect the underlying financial momentum to be strongly evident.”
BP plc (ADR) (NYSE:BP)‘s future looks promising, but what about current valuations? Comparing two top oil companies, Exxon Mobil Corporation (NYSE:XOM) and Chevron Corporation (NYSE:CVX), to BP should give us a better idea.
| Valuation | BP | Chevron | Exxon Mobil |
| P/E | 11.20 | 8.90 | 9.20 |
| Forward P/E | 7.80 | 9.63 | 10.83 |
| Price/Book | 1.09 | 1.70 | 2.40 |
| Price/Sales | 0.34 | 0.98 | 0.82 |
| Yield | 5.30% | 3.00% | 2.60% |
Among the highlights are BP’s forward P/E of 7.80, a price/book of 1.09, and a price/sales of 0.34 — the lowest I found in the industry. Finally, BP’s 5.30% yield is well above the industry average yield of 4.80%.
A quick note on the price/sales figure. Following the DH, BP’s earnings took a huge hit, while sales continued to increase. This caused a historically large divergence between sales and profitability. As BP returns to normal (historic) levels of profitability, we can multiply the current industry average price-to-sales ratio of 0.66 to BP plc (ADR) (NYSE:BP)‘s current revenue of $118/share, and come up with an estimated target price of $78.
Building on the P/S thesis above, comparing sales growth would give another idea of BP’s potential.
| Valuation | BP | Chevron | Exxon Mobil |
| Sales (MRQ) vs Sales One Year Ago | 10.00% | 5.90% | 7.30% |
Combining BP’s sales growth of 10.00% with an expected return to historic profitability makes the potential undeniable.
Examining a five year chart comparing the three, there are some things worth noting.
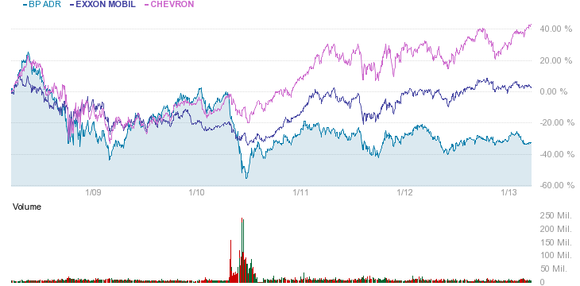
Exxon Mobil is often touted as a must-own stock, but has remained dead money. While its dividend made for positive gains, its five-year average yield was only 2.30%. With a five-year average inflation rate of 1.99% and a current inflation rate of 1.98%, that yield looks less attractive.
Chevron Corporation (NYSE:CVX) is climbing to record highs. But value investors should be skeptical about chasing performance when fundamentals indicate the stock is becoming expensive.
| Valuations | Chevron | Industry |
| P/E | 9.00 | 9.20 |
| Price/Sales | 0.99 | 0.64 |
| Price/Book | 1.71 | 1.61 |
| Yield | 3.00 | 4.80 |
With the lowest (MRQ) sales increase of the three, higher-than-average P/B and P/S, and a lower than average 3.00% yield, Chevron’s potential seems limited.
Finally, forward P/E’s for both Exxon Mobil Corporation (NYSE:XOM) and Chevron are greater than current P/E’s. As a general rule, it’s unwise to invest in companies that the market projects will either have earnings or margin issues.
BP has been stable over the last two years, and its recent consolidation provides an element of safety. As a refocused company with great future potential and attractive valuations, BP plc (ADR) (NYSE:BP) looks highly appealing at these prices. While there is still an element of speculation regarding ongoing DH litigation, BP plc (ADR) (NYSE:BP)’s long term risk/reward seems highly favorable.
You Could Use a Spa Day
Many Americans aren’t aware of Enersis S.A. (ADR) (NYSE:E). But this Italian integrated oil and gas giant has a presence in 85 nations.
What makes Eni SpA special is an industry-leading per-unit exploration cost of around $1.70/boe over the past four years. Also, between now and 2015, Eni SpA will add around 700,000 boe/d of new production through over 60 major start ups, 80% of which will come from new giant projects with long plateau periods.
This cost-effective
exploration helps Eni deliver sustainable profitability on new projects under almost any oil-price scenario, putting them at a competitive advantage during the most difficult of times.
This was reflected in the most recent year which experienced slightly depressed oil prices. The industry averaged a low net profit margin of 0.06%, while Eni SpA sported a 6.7% net profit margin, which was in line with historical averages.
Lately, this efficiency has been combined with an aggressive business plan aimed at increasing sales and consequently earnings. It seems to be working. The most recent quarter’s sales rose 35.20% year over year, while EPS was up an astonishing 62.60% for the same period.
Not only is Eni SpA efficient at discovery, but it also presents a compelling value play. Using the same comparison as earlier, with both Exxon Mobil and Chevron Corporation (NYSE:CVX), Eni SpA looks inexpensive.
| Valuation | Eni SpA | Chevron | Exxon Mobil |
| P/E | 8.30 | 8.90 | 9.20 |
| Forward P/E | 7.95 | 9.63 | 10.83 |
| Price/Book | 1.12 | 1.70 | 2.40 |
| Price/Sales | 0.50 | 0.98 | 0.82 |
| Yield | 4.70% | 3.00% | 2.60% |
With an attractive yield of 4.7%, competitive margins, and a long-term plan for increasing returns, Eni SpA looks attractive. Its recent decline of 8% over the last 45 days could be a solid entry point for this winning stock.
Conclusion:
When the market hands you an unjustified decline, don’t be afraid to invest in good companies. Despite their recent drops, these European oil stocks remain sound, and in most cases growing at significant rates. The value is clearly present. Nothing has changed except the price.
The article Power Your Portfolio With These Stocks originally appeared on Fool.com and is written by James Catlin.
Copyright © 1995 – 2013 The Motley Fool, LLC. All rights reserved. The Motley Fool has a disclosure policy.


