Atlantic Power Corp (NYSE:AT) shares are down 60% this year, and investors are wondering whether there’s any upside left to this dividend downer. With Q1 earnings on Thursday, investors need to know the answer to a very important question: Is Atlantic Power stock undervalued? In part one of this segment, I examined the company’s fundamentals. In part two, let’s take a look at Atlantic’s valuation.

Nice assets
Before micro-analyzing sales and earnings opportunities, investors would do well to remember the age-old adage: “A bird in the hand is worth two in the bush.” A company’s assets tell us how much it owns, liabilities tell us how much it owes, and equity provides a peek at its overall standing.
In a scenario such as Atlantic Power Corp (NYSE:AT)’s, when shares have plummeted so far as to create potential fire-sale opportunities, I find it best to look at price-to-book ratio. This metric is essentially comparing price to equity, except that it also takes out the fluff of intangibles. No future earnings expectations, no crack management team, no brand power…no nothing. Let’s see how our utilities add up:

AT Price / Book Value data by YCharts
Birds or not, there’s no beating around the bush: Atlantic Power Corp (NYSE:AT) is cheap. Trading at just 76% of its price-to-book ratio, investors don’t have much faith in the utility’s future. On the opposite end, TECO Energy, Inc. (NYSE:TE)‘s books are a long way from the bargain bin. The utility’s coal-centric energy portfolio has been on the rise this year, and expectations of more expensive natural gas have pushed prices to premiums in the last few months.
Cold hard cash
While books provide a robust reading of a company’s worth, there’s no underestimating the power of cold, hard cash. For utilities especially, cash flow is the electricity behind its earnings, ensuring a constant build of capital to get it through infrequent but massive capital expenditures.
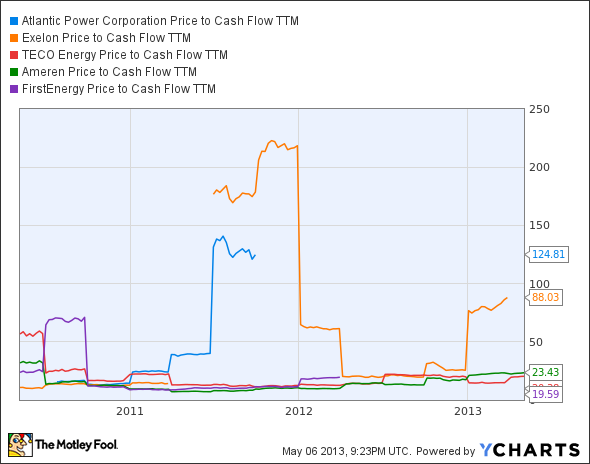
AT Price to Cash Flow TTM data by YCharts
Unfortunately for our purposes, erratic cash flow makes any direct conclusions relatively difficult. Although it’s not linked to prices, let’s instead take a look at changes in free cash flow over the last three years.

AT Change in Cash TTM data by YCharts
TECO Energy, Inc. (NYSE:TE) and Exelon Corporation (NYSE:EXC) have managed to maintain positive cash flows, but Exelon Corporation (NYSE:EXC)’s relative scale makes its most recent gains less significant. On the lower end, FirstEnergy Corp. (NYSE:FE) fumbled away $30 million in cash, while Atlantic Power Corp (NYSE:AT)’s operations have remained steady.


