Whether you’re a fan or a foe, there’s no denying Apple Inc. (NASDAQ:AAPL)‘s absolutely remarkable run. On May 1, 2003, its adjusted share price was just $7. Today, it trades for roughly $450 — a 64-fold increase, and one of the great run-ups in investing history. Recently, however, Apple has plunged from an all time high of $700.
Is this just a pause in a continued run, or are Apple Inc. (NASDAQ:AAPL)’s days of price appreciation over?
I’ll tackle the positive side of that question in a future post. For now, let’s examine why Apple Inc. (NASDAQ:AAPL) might be headed into a downward spiral.
Current Price
After bottoming at $385 just a month ago, Apple Inc. (NASDAQ:AAPL) stock now seems to have begun a new run up, having rallied more than $60 in the last few weeks. Still, in the past two days it dropped $26 to $428.85, and so it is not certain if this is indeed a recovery, the beginning of another drop, or perhaps one of Apple’s long, sideways channels.
The Problem: Margin Erosion
There are a lot of reasons given for Apple Inc. (NASDAQ:AAPL)’s big fall, but in the end, the most compelling is its shrinking margins. Last month, the iconic iDevice maker had the unenviable task of reporting a year-over-year increase in revenue ($43.6 billion vs. $39.2 billion), but a decrease in net profits ($9.5 billion vs. $11.6 billion, or $10.09 vs. $12.30 EPS).
This is the third quarter in a row in which the report seriously disappointed many investors. (See here and here.) In particular, Apple issued seriously disappointing guidance about its expected future margins.
This is indeed what Wall Street had predicted, and precisely what caused the discrepancy between this past quarter’s earning dip, in spite of an increase in revenue.
If we look at the first chart, we can see that net profit margin parallels very closely the gross margin line. Therefore, any significant drop in the latter will negatively affect the former. This, combined with a slower rate of growth in revenue is what caused an earnings per share drop from a year ago – for the first time in over 10 years.

AAPL Gross Margin vs. Net Margin Quarterly data by YCharts
The second chart below shows the growth of revenue and EPS over the last 10 years. The gross margin is in red, and we can see how it, too, ramped up in that time frame, reaching a high of 47%.

AAPL Revenue | EPS | Gross Margin over 10 years Quarterly data by YCharts
But now that has dropped precipitously. This past quarter showed only a 37.5% gross margin, down almost 10 percentage points from the previous year. The effect this had can be seen more in the third chart below, whose shorter time frame highlights how the current drop in margin has “pulled” the EPS down away from the revenue.
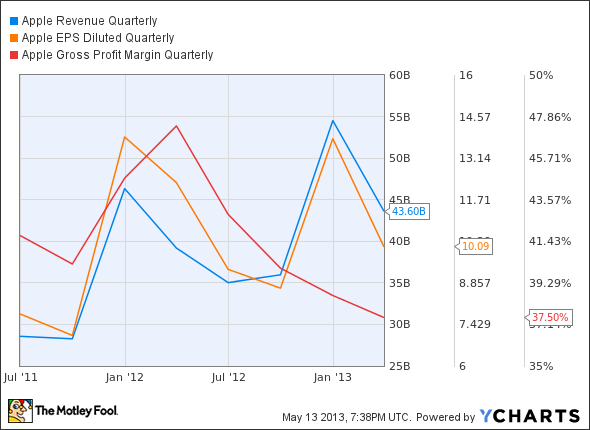
AAPL Revenue | EPS | Gross Margin Quarterly (2 years) data by YCharts
Apple’s recent history shows that its gross margins tend to run up to sharp peaks that are followed by valleys before the next run, so this perhaps, should not be so surprising. But this particular disparity is extraordinary for two reasons:
1). It is so large, and
2). The year-over-year revenue growth (11.3%) is one of the lowest in 10 years. (2009 saw just one quarter with negative growth.)
Apple doubters have been predicting the company’s fall for years, and they now argue that its time has come. In their opinion, Apple has lost its throne to the open Android platform, and this recent decline is just the beginning.


