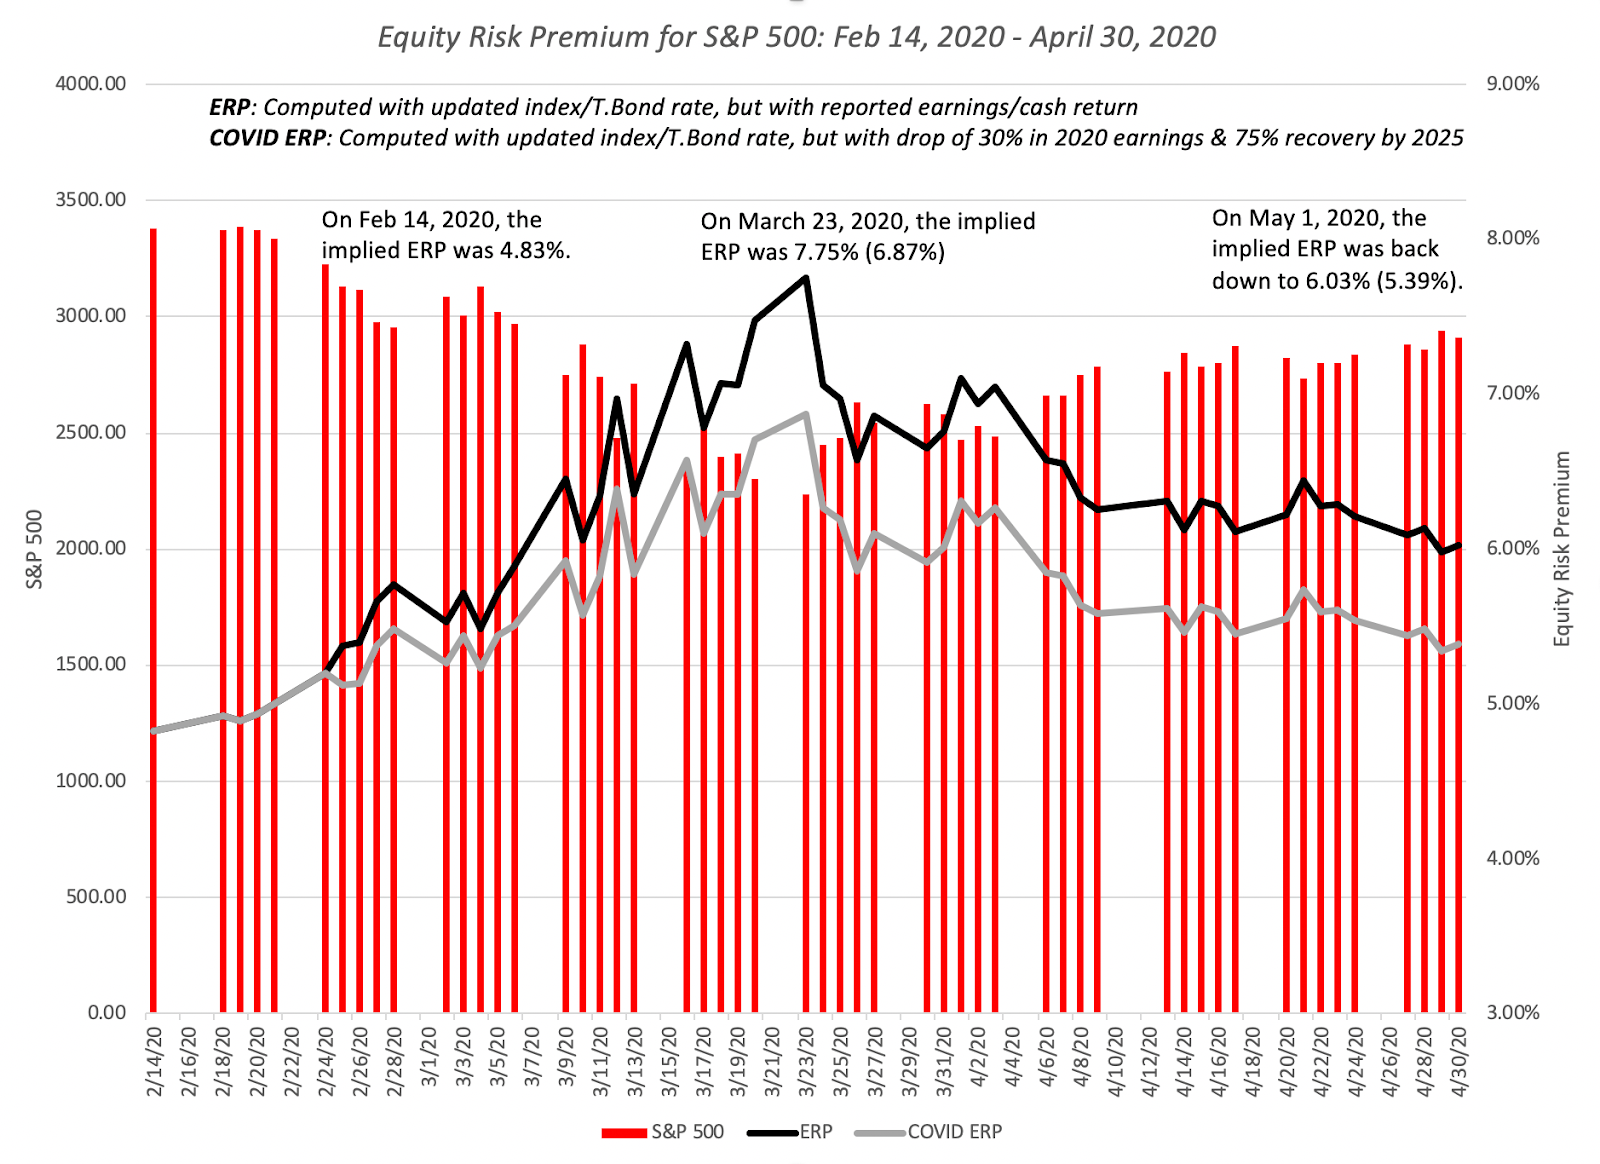
Early in this crisis, the corporate bond markets did not reflect the worry and fear that equity investors were exhibiting, but they caught on with a vengeance a couple of weeks in, and the damage was clearly visible by April 3, 2020, with default spreads almost tripling across the board for all ratings classes. Since April 3, the spreads have declined, but remain well above pre-crisis levels. There should be no surprise that the price of risk in the bond market has risen, and as the crisis has taken hold, I have been updating equity risk premiums daily for the S&P 500 since February 14, 2020:
 |
| Download data |
The equity risk premium surged early in the crisis, hitting a high of 7.75% on March 23, but that number has been dropping back over the last weeks, as the market recovers. By May 1, 2020, the premium was back down to 6.03%, with pre-crisis earnings and cash flows left intact, and building in a 30% drop in earnings and a 50% decline in buybacks yields an equity risk premium of 5.39%. For good reasons or bad, the price of risk in the equity market seems to be moving back to pre-crisis levels. I don’t track commodity prices on a regular basis, but I chose to track oil and copper prices since February 14:
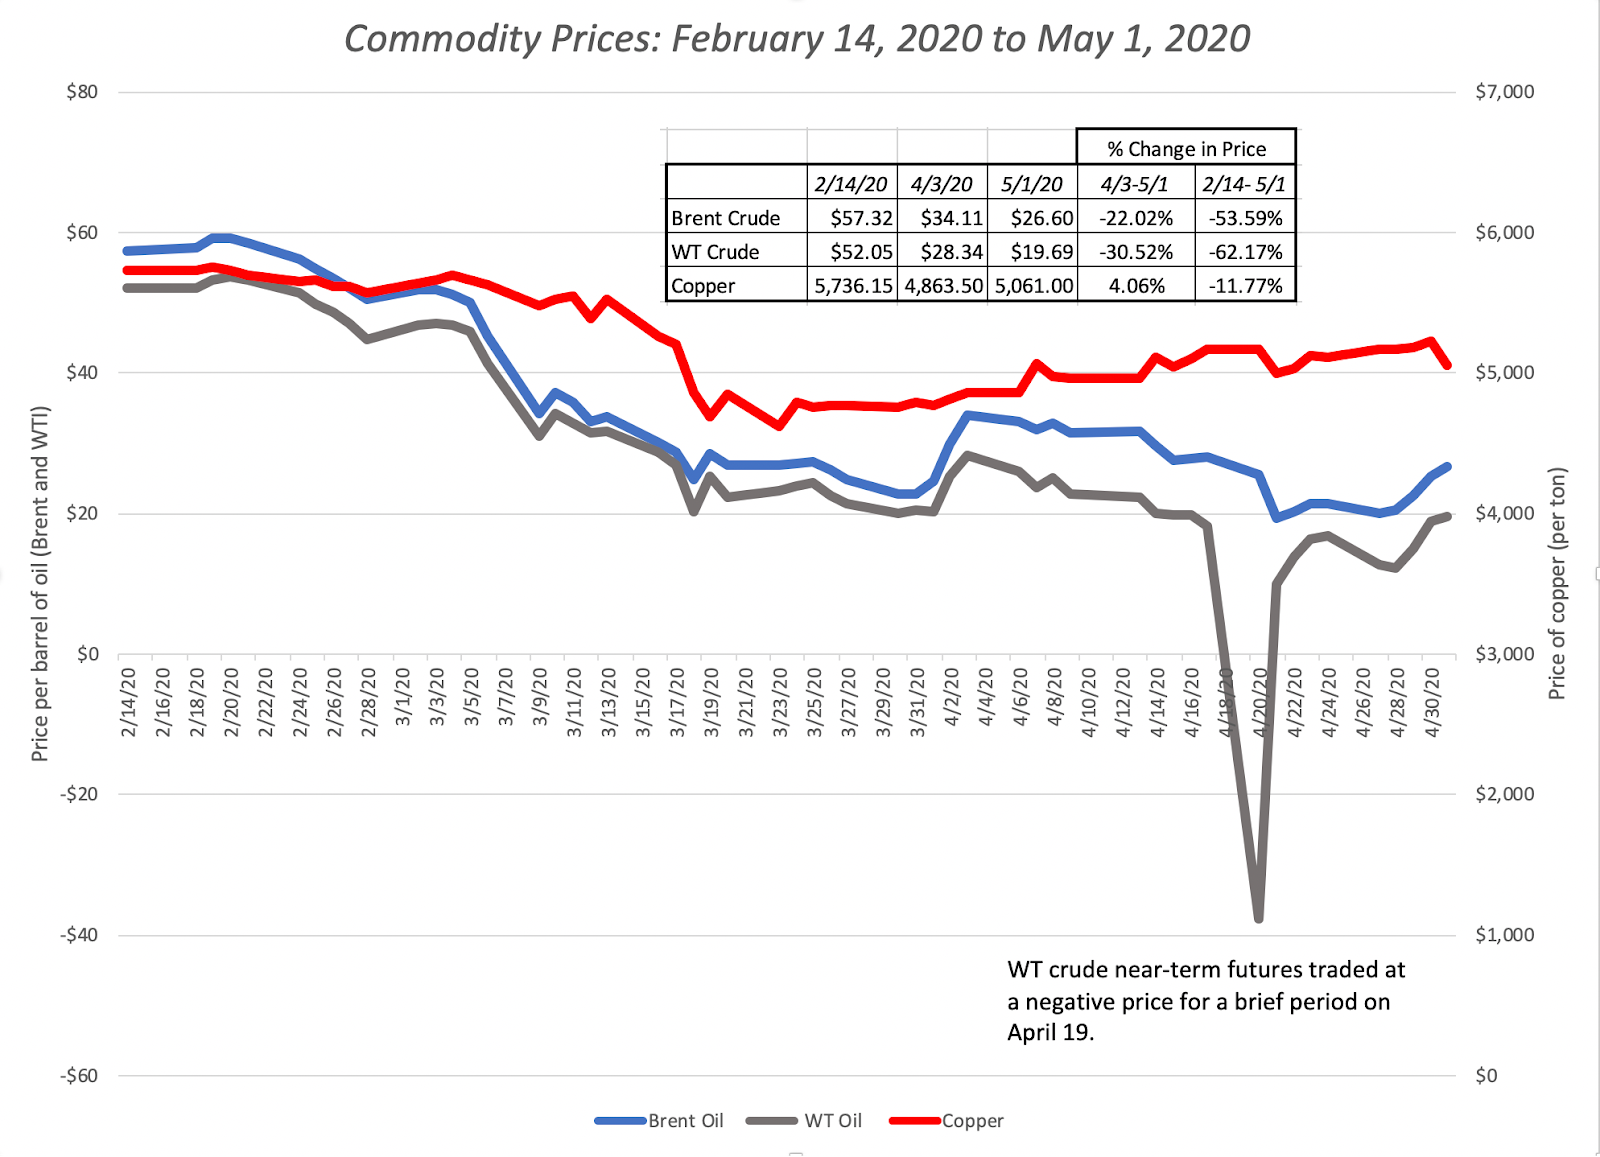 |
At the risk of repeating what I have said in prior weeks, the drop in copper prices is consistent with an expectation of a global economic showdown but the drop in oil prices reflects something more. In fact, a comparison of Brent and West Texas crude oil prices highlights one of the more jaw-dropping occurrences during this crisis, when the price of the latter dropped below zero on April 19. The oil business deserves a deeper look and I plan to turn to that in the next few weeks. Finally, I look at gold and bitcoin prices during the crisis, with the intent of examining their performance as crisis assets:
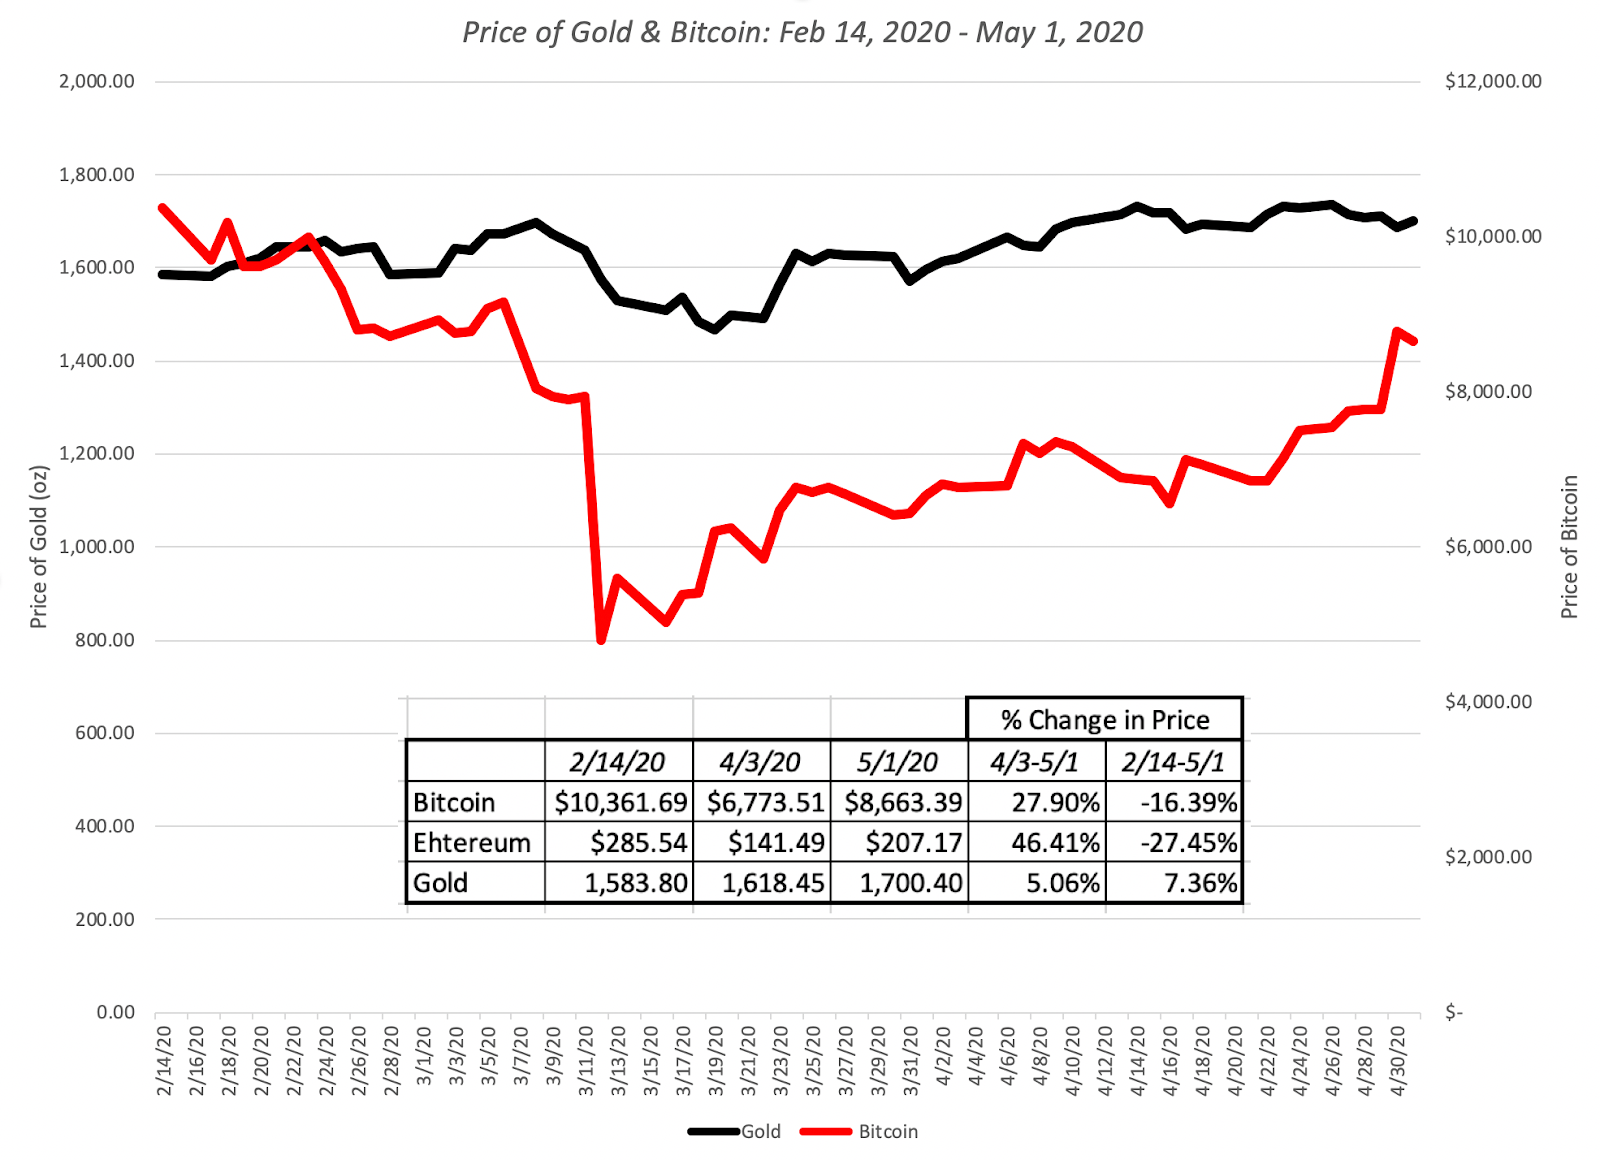
Gold has held its own, but I think that the fact that it is up only 7.4% must be disappointing to true believers, and Bitcoin has behave more like equities than a crisis asset, and very risky equities at that, dropping more than 50% during the weeks when stocks were down, and rising in the next few weeks, as stocks rose, to end the period with a loss of 16.37% between February 14 and May 1.
Equities: A Breakdown
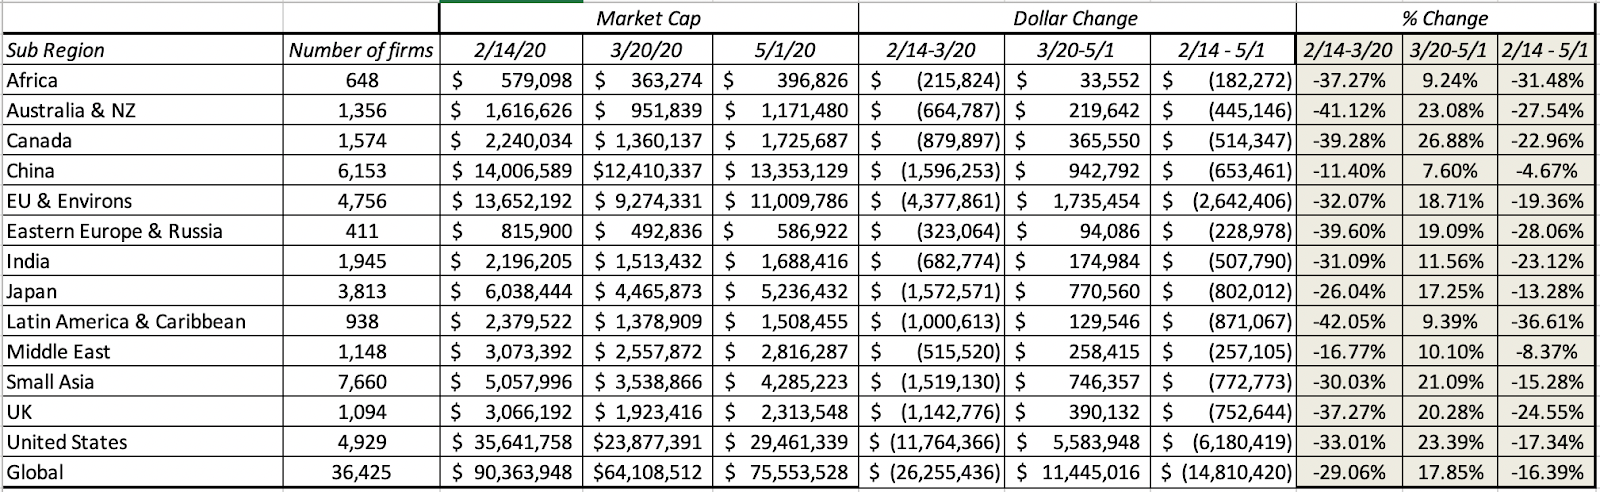
Starting with the market capitalizations of individual companies, I measured the change in market capitalization on a week to week basis, allowing me to slice and dice the data to chronicle where the damage has been greatest and where it has been the least. Breaking down companies by region, here is what the numbers updated through May 1 look like:
 |
| Add caption |
Latin America has been the worst performing region in the world, with Africa, Australia and Russia right behind and China and the Middle East have been the best performing regions between February 14 and May 1. I continue the breakdown on a sector-basis in the table below:
 |
| Add caption |
Health care, consumer staples and technology have been the best performing sectors and financials are now the biggest losers. Extending the analysis to industries and looking at the updated list of worst and best performing industries:
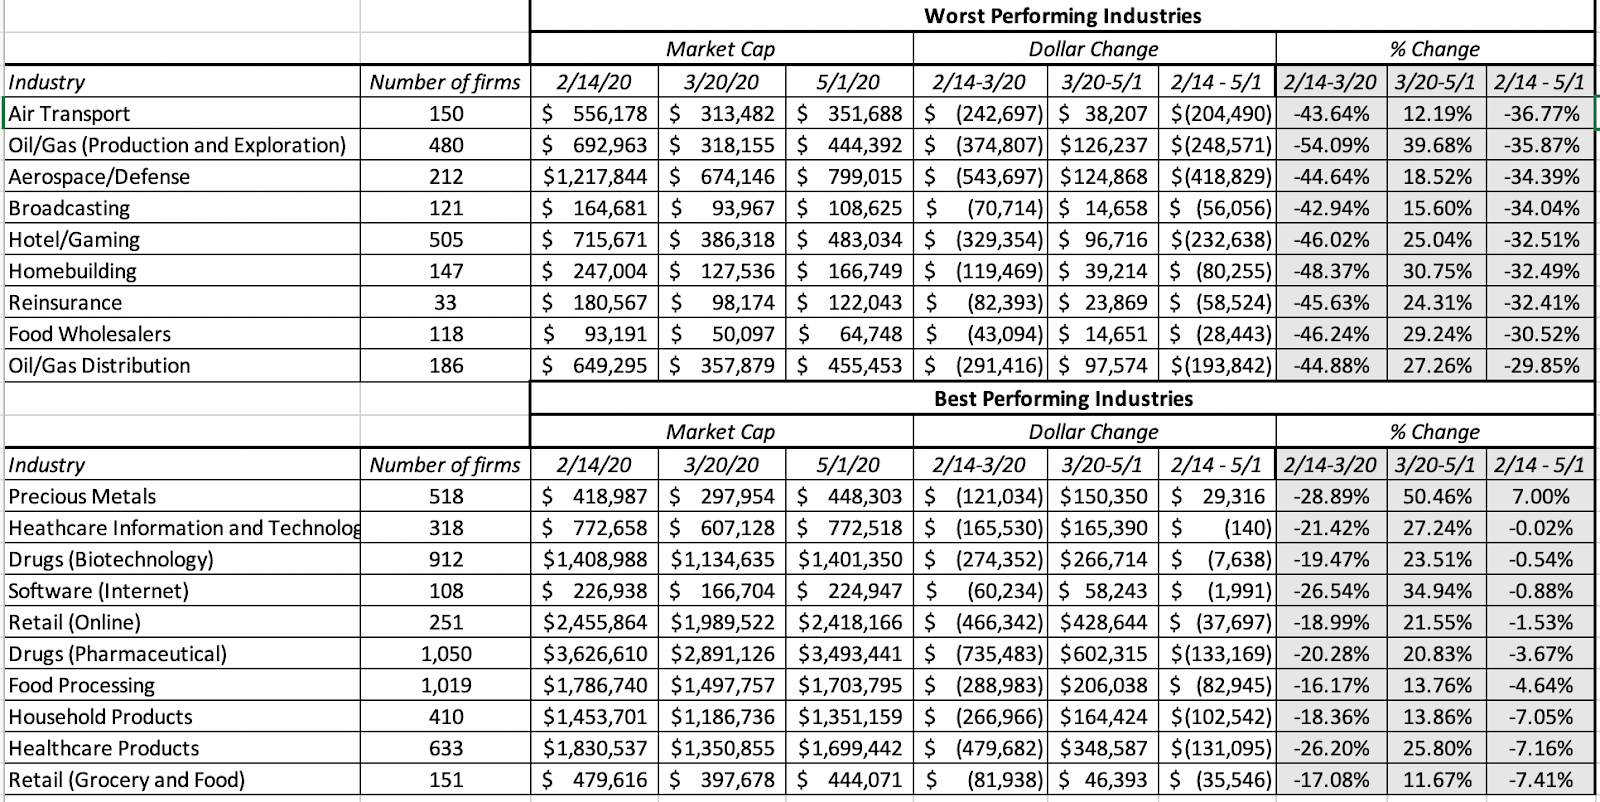 |
| Add caption |
Repeating a refrain from my updates in earlier weeks, this has been, as crises go, about as orderly a retreat as any that I have seen. The selling has been more focused on sectors that have heavy capital investment and oil-focused, burdened with debt, and has been much more muted in sectors that have low capital intensity and less debt.


