The foreign exchange market also known as FX or forex is a marketplace for traders to exchange currencies. The forex market is arguably the largest one in the world when compared to bonds and equities. It plays a key role in the global financial system enabling the international purchase and sale of goods and services.
While fixed income securities and stocks are traded on an exchange, forex is traded over the counter. So, here transactions don’t occur on a centralized platform but between traders with access to computer networks all over the world. The foreign exchange market is open 24 hours a day and is operational for five and a half days each week. The currencies are traded across time zones and thrive on liquidity making it extremely attractive to traders.
However, trading in the forex markets carry significant risks as these financial instruments are not standardized. Before you enter forex trading, you need to learn about these instruments, set up an account with a trustworthy broker, and develop a trading strategy.
Here, we look at a few forex signals that can help you understand these volatile markets better. Trading signals are provided by companies or platforms that will help the novice trader make better buying or selling decisions. You can take a fundamental approach towards forex trading where you analyze macroeconomic events that can influence currency prices. These might include interest rate announcements by the Federal Reserve or any such market-moving news.
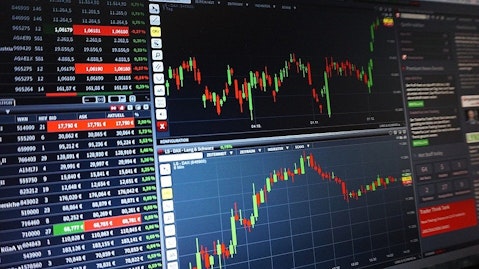
Alternatively, technical analysis considers historical price movements and charting patterns. Traders can focus on price movements in the past and predict future trends in case a similar pattern keeps repeating. The ability to read technical chart patterns will allow traders to predict price movements which will help accelerate an individuals’ buying or selling decision.
Some of these chart patterns are discussed here.

Moving average crossover
One of the easiest trends to follow is the moving average crossover. Here, you need to look at a simple moving average which is basically an asset’s average closing price over a certain time period. So, if you look at the 50-day/200-day moving average crossover for currencies, there is a favorable trend when the 50-day average is below the 200-day average.
You can use several combinations of moving averages. However, traders should be ready for whipsaws or a reversal in price trends given that there is no combination that will allow you to predict currency movements accurately all the time.
Moving average convergence divergence
While the moving average crossover is a trend-following signal, the MACD or the moving average convergence divergence is a trend confirmation signal. Similar to the moving average crossover, the MACD may help traders identify buy and sell signals.
The MACD is a technical indicator where you can measure the difference between two smoothed moving averages. Generally, the MACD is calculated by subtracting the difference between the 26-day exponential moving average (EPA) and the 12-day EMA which is also known as the 14-day MACD.
The difference in the smoothed averages is then compared to a current moving average. So, if the smoothed average is trading above its current average, a positive uptrend can be confirmed.
The trader can leverage the signals of the MACD as well as the moving average crossover to confirm if a trend is bullish or bearish. If both the signals point towards a positive trend, you can take a long position on the currency pair and vice versa.
Relative strength index
Another technical tool is the relative strength index. A trader might first look at the MACD and moving average crossover to establish a clear trend. After a particular trend is established, the trader will have to decide if it makes sense to trade at current levels or wait for a pullback. In case you choose the latter, you need to look at the relative strength index or RSI which is also known as the overbought/oversold indicator.
The RSI is a momentum indicator which is displayed as an oscillator and has a reading between 0 and 100. The general rule is to analyze 14-day price movements to calculate the RSI value. In case, the RSI value is below 30, it suggests that the asset is oversold and if the value is over 70, it indicates that the asset is overbought.
Bollinger Bands
While the above three signals will provide you with information regarding buying or selling opportunities, Bollinger bands is a profit-booking tool that considers standard-deviation of price changes for a particular period. It then adds or subtracts these prices from the closing price over this period to create trading bands.
In case the price touches the upper band, a trader might book profits if he is holding a long position. Alternatively, a trader with a short position on a currency pair might exit the position if the price touches the lower band.
The final takeaway
The forex markets may seem complex and out of bounds for even the most experienced traders. However, you can create a trading strategy for a particular currency pair and generate consistent profits if you remain disciplined. We have seen that the above signals should not be viewed in isolation but as a combination to help you predict price movements.


