Dividend stocks outperform non-dividend-paying stocks over the long run. It happens in good markets and bad, and the benefit of dividends can be quite striking: Dividend payments have made up about 40% of the market’s average annual return from 1936 to the present day. But few of us can invest in every single dividend-paying stock on the market, and even if we could, we might find better gains by being selective. That’s why we’ll be pitting two of the Dow Jones Industrial Average‘s dividend payers against each other today to find out which is the true dividend champion. Let’s take a closer look at our two contenders now.
Tale of the tape
General Electric Company (NYSE:GE) is the only member of the Dow’s century club, as it has been a continuous component since 1907. The Schenectady, N.Y.-based industrial conglomerate has successfully navigated more than a century of change without losing its foundational identity, as you’ll still find GE turbines and engines in power plants and high-performance transportation around the world. In keeping with its focus on electricity, General Electric Company (NYSE:GE) has also made significant inroads toward an alternative-energy future, which makes it a real threat to the future of its opponent today.
Exxon Mobil Corporation (NYSE:XOM) is another of the Dow’s longest-tenured components, with a continuous streak of membership dating back nearly 85 years. Based in the Dallas suburb of Irving, Texas, ExxonMobil is the largest and most direct descendant of Standard Oil, and it also happens to be the largest component on the Dow. ExxonMobil produces more oil and gas than many countries, which gives it a dominant market position that’s unlikely to erode unless the world engages in a wholesale transition from petroleum products to alternative energy.
| Statistic | General Electric | ExxonMobil |
|---|---|---|
| Market cap | $245.1 billion | $411.4 |
| P/E ratio | 16.4 | 9.3 |
| TTM profit margin | 9.6% | 9.6% |
| TTM free-cash-flow margin* | 9.5% | 3.5% |
| Five-year total return | (7.6%) | 10.7% |
Source: Morningstar and YCharts. TTM = trailing-12-month.
*Free-cash-flow margin is free cash flow divided by revenue for the trailing 12 months.
Exxon Mobil Corporation (NYSE:XOM) has size and valuation on its side, but GE has the better free-cash-flow margin — an important consideration for dividend investors. Which of these two stalwarts will come out ahead?
Round one: endurance

Round two: stability
Paying dividends is all well and good, but how long have our two companies been increasing their dividends? The same dividend payout year after year can quickly fall behind a rising market, and there’s no better sign of a company’s financial stability than a rising payout in a weak market (so long as it’s sustainable, of course). This one is an easy victory for Exxon Mobil Corporation (NYSE:XOM), as General Electric Company (NYSE:GE) was forced to drastically cut its dividend in the aftermath of the 2008 financial crisis, while the oil giant hasn’t reduced its payout in decades.
Round three: power
It’s not that hard to commit to paying back shareholders, but are these payments enticing or merely token? Let’s take a look at how both companies have maintained their dividend yields over time as their businesses and share prices grow:

GE Dividend Yield data by YCharts.
General Electric Company (NYSE:GE) squeaks ahead in this one, as it has remained in the lead for nearly the entire five-year period, regardless of that big spike during its share-price meltdown.
Round four: strength
A stock’s yield can stay high without much effort if its share price doesn’t budge, so let’s take a look at the growth in payouts over the past five years. If you bought in several years ago and the company has grown its payout substantially, your real yield is likely look much better than what’s shown above.
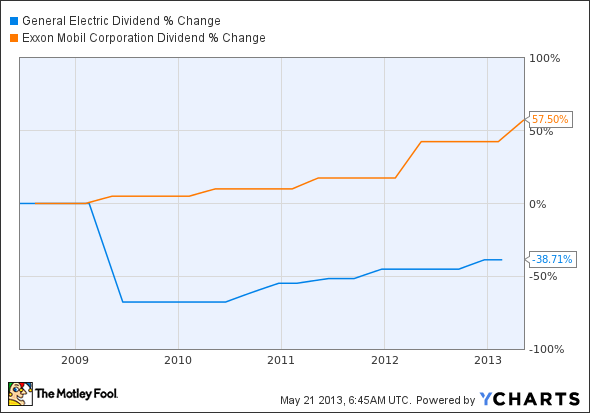
GE Dividend data by YCharts.
Round five: flexibility
A company — even one as well-positioned as GE or Exxon Mobil Corporation (NYSE:XOM) — needs to manage its cash wisely to ensure that there’s enough available for tough times. Paying out too much of free cash flow in dividends could be a warning sign that the dividend is at risk, particularly if business weakens. This next metric analyzes just how much of their free cash flows our two companies have paid out in dividends over the past several quarters:

GE Cash Div. Payout Ratio TTM data by YCharts.
It’s a tie! There aren’t many other direct comparisons we can use as a tiebreaker, but we can examine financial stability through each company’s debt-to-equity ratio. A lower ratio implies a stronger balance sheet, which will grant a company more freedom to sustain its dividend during difficult times. On this measure, there’s no contest:

GE Debt to Equity Ratio data by YCharts.
Do you agree with this analysis, or does General Electric Company (NYSE:GE) have a brighter future regardless of its recent stumble? No matter which company you choose, you’re likely to get a stable payout for many years to come. However, if you have limited resources, it can be smart to allocate what you have to a stronger stock — which, in this case, is Exxon Mobil Corporation (NYSE:XOM) by a hair.
The article General Electric vs. ExxonMobil: Which Dow Stock’s Dividend Dominates? originally appeared on Fool.com and is written by Alex Planes.
Fool contributor Alex Planes has no position in any stocks mentioned. The Motley Fool owns shares of General Electric Company.
Copyright © 1995 – 2013 The Motley Fool, LLC. All rights reserved. The Motley Fool has a disclosure policy.

