Quest Diagnostics Inc (NYSE:DGX) recently reported its preliminary financial results based on which we provide a unique peer-based analysis of the company. Our analysis is based on the company’s performance over the last twelve months (unless stated otherwise). For a more detailed analysis of this company (and over 40,000 other global equities) please visit www.capitalcube.com.
Quest Diagnostics Inc.’s analysis versus peers uses the following peer-set: Laboratory Corp. of America Holdings (NYSE:LH), Sonic Healthcare Limited (ASX:SHL), Qiagen NV (NASDAQ:QGEN), Alere Inc (NYSE:ALR), Genomic Health, Inc. (NASDAQ:GHDX) and Bio-Reference Laboratories Inc (NASDAQ:BRLI). The table below shows the preliminary results along with the recent trend for revenues, net income and returns.
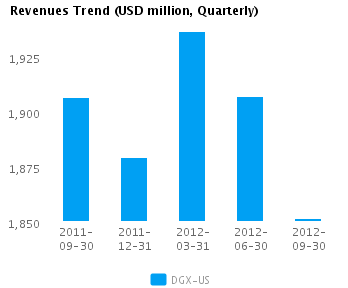
| Quarterly (USD million) | 2012-09-30 | 2012-06-30 | 2012-03-31 | 2011-12-31 | 2011-09-30 |
|---|---|---|---|---|---|
| Revenues | 1,851.4 | 1,906.8 | 1,936.5 | 1,879.3 | 1,906.4 |
| Revenue Growth % | (2.9) | (1.5) | 3.0 | (1.4) | 0.2 |
| Net Income | 163.1 | 177.8 | 158.8 | 189.9 | 172.1 |
| Net Income Growth % | (8.2) | 11.9 | (16.3) | 10.3 | 5.2 |
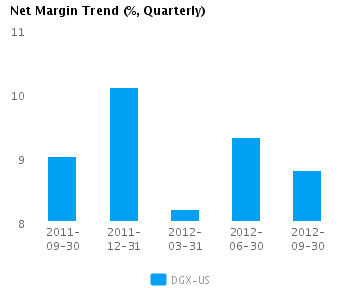
| Net Margin % | 8.8 | 9.3 | 8.2 | 10.1 | 9.0 |
| ROE % (Annualized) | 16.0 | 18.1 | 16.8 | 21.1 | 19.8 |
| ROA % (Annualized) | 7.0 | 7.5 | 6.8 | 8.1 | 7.3 |
Valuation Drivers
Quest Diagnostics Inc.’s current Price/Book of 2.4 is about median in its peer group. We classify DGX-US as Harvesting because of the market’s low expectations of growth (PE of 14.8 compared to peer median of 19.8) despite its relatively high returns (ROE of 17.9% compared to the peer median ROE of 12.4%).
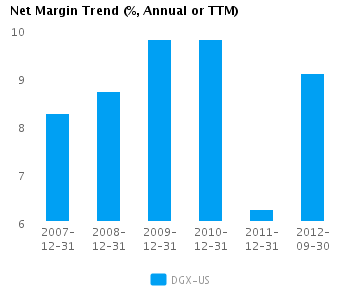
The company’s asset efficiency (asset turns of 0.8x) and net profit margins of 9.1% are both median for its peer group. DGX-US’s net margin has increased 2.9 percentage points from last year’s low and is now above its five-year average net margin of 8.6.
Economic Moat
Changes in the company’s annual top line and earnings (1.9% and -35.1% respectively) generally lag its peers. This implies a lack of strategic focus and/or inability to execute. We view such companies as laggards relative to peers.
DGX-US’s current return on assets is around peer median (7.4% vs. peer median 6.6%). This contrasts with its higher than peer median return on assets over the past five years (7.5% vs. peer median 6.1%), suggesting that the company’s relative operating performance has declined.
The company’s gross margin of 44.9% is around peer median suggesting that DGX-US’s operations do not benefit from any differentiating pricing advantage. However, DGX-US’s pre-tax margin is more than the peer median (14.9% compared to 11.1%) suggesting relatively tight control on operating costs.
Growth & Investment Strategy
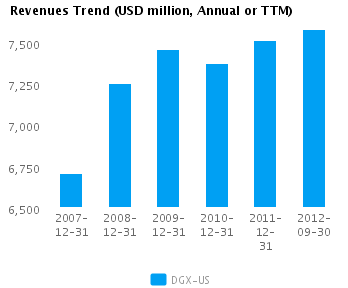
DGX-US’s revenues have grown more slowly than the peer median over the last few years (1.2% vs. 9.4% respectively for the past three years) and the stock price’s relatively low PE ratio of 14.8 implies relatively low future growth as well. Overall, we view the company’s growth expectations as substandard relative to its peers.
DGX-US’s annualized rate of change in capital of 4.9% over the past three years is less than its peer median of 8.9%. This investment has generated a better than peer median return on capital of 9.1% averaged over the same three years. This combination of a relatively low investment with good returns suggests that the company is likely milking its business.
Earnings Quality
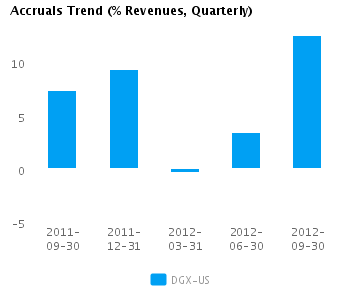
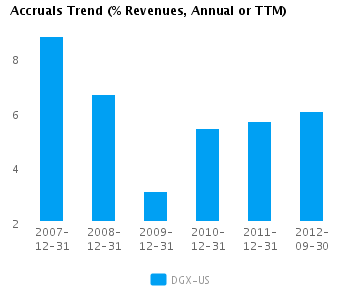
DGX-US’s net income margin for the last twelve months is around the peer median (9.1% vs. peer median of 7.9%). This average margin combined with a level of accruals that is around peer median (6.0% vs. peer median of 6.0%) suggests there possibly isn’t too much accrual movement flowing into the company’s reported earnings.
DGX-US’s accruals over the last twelve months are positive suggesting a buildup of reserves. However, this level of accruals is also around the peer median and suggests the company is recording a proper level of reserves compared to its peers.
Trend Charts
Company Profile
Disclaimer
This article was originally written by abha.dawesar, and posted on CapitalCube.


