The Procter & Gamble Company (NYSE:PG)‘s second-quarter earnings have enabled its shares to break free of recent gravity. Since reporting on Jan. 25, P&G has watched its stock price appreciate nearly 7.5%. Because core earnings increased 12% versus the prior year, and also because of management’s confident increase in earnings guidance, advocates are sleeping peacefully again without the help of P&G’s new ZzzQuil sleep aid. Shareholders may be well advised to limit the slumber to a power nap, however: The single quarter hasn’t erased some near-term issues that may affect the company in 2013.
P&G has lost some of its dynamism in recent years. Since coming off a record year of revenue and net income in 2008, the company has delivered unimpressive revenue growth, first declining in 2009, and subsequently clawing back at an average rate of 2.3% growth per year from fiscal 2010 through 2012. Moreover, net income has deteriorated: At $10.5 billion in 2012 on $83.7 billion in sales, the bottom line is roughly 13% lower than the 2008 peak. While the storied giant plodded along, its consumer-goods peers were rewarded for their higher growth rates:
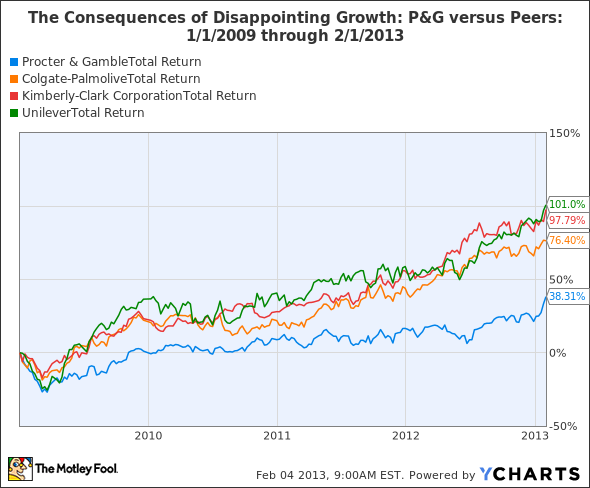
PG Total Return Price data by YCharts.
During the past four fiscal years, Kimberly Clark Corp (NYSE:KMB) and Colgate-Palmolive Company (NYSE:CL) have averaged 2.5% and 2.9% revenue growth, respectively. Kimberly-Clark’s annual revenue is $21 billion, and Colgate books annual revenue of $17 billion, so they are each a quarter of P&G’s size and should be expected to grow their top lines more quickly than P&G. However, Unilever plc (NYSE:UL) , of comparable size to P&G at annual sales of 51 billion euros, has dusted all three companies recently, averaging 6.9% annual revenue growth over the same period.
Better margins: We’ve been here before
P&G won’t grow its sales like Unilever anytime soon, but it does enjoy a higher gross margin. One of the drivers of new-found optimism surrounding P&G is its margin improvement, resulting from productivity enhancements and cost-cutting. Core gross margin increased more than 1 percentage point in the most recent quarter versus the prior year, from 50.1% to 51.2%. While this is a vigorous improvement, it’s still below the gross margin P&G enjoyed in 2010, when the comparable margin stood at 51.8%. So in some ways P&G is being rewarded for getting back to the status quo.
Strong cash flow yet scant resources?
One area P&G might want to restore to the status quo is its resources on hand. When the company acquired Gillette in 2005, it added $64.5 billion of goodwill and intangible assets to its balance sheet. As a result, tangible net book value in the year of acquisition fell to negative $26 billion. In funding the transaction, the company’s total liabilities also mushroomed, from $43 billion to $79 billion. As the following chart reveals, P&G has done little to amend either of these conditions:

PG Tangible Book Value data by YCharts.
Between fiscal year 2006 and 2012, P&G generated $97.46 billion of cash from operations. But the balance sheet actually shrank by $3.5 billion over this time span, and embarrassingly for a company perceived to be so solid, P&G hasn’t recorded a quarter with a positive current ratio in more than six years. If the company hasn’t paid down its debt, and has neglected to significantly improve its cash balances or net fixed assets (either action would reduce the negative tangible book value), where has all its excess cash gone? Why, in your pocket, shareholder! From the 2006 fiscal year, when P&G swallowed Gillette whole, to the end of its last fiscal year, P&G has paid out $35 billion in dividends and repurchased a cool $56 billion worth of shares.


