Bullish fundamentals and bearish realities
There’s no one surefire indicator that points to an imminent market reversal, but there are some easily understandable fundamental metrics that can help provide clarity. The duration of a bull market, which I mentioned earlier, has little relationship to its ultimate gain and little influence over when it ends. What matters more are marketwide valuations, which have been best calculated by Robert Shiller with the cyclically adjusted P/E ratio. The CAPE has shown to have a 0.77 correlation to the movement of stocks since 1881, tracking performance far more closely than most other marketwide metrics. That’s important to understand, because only a few other bullish periods come close to the current one in terms of valuation expansion.
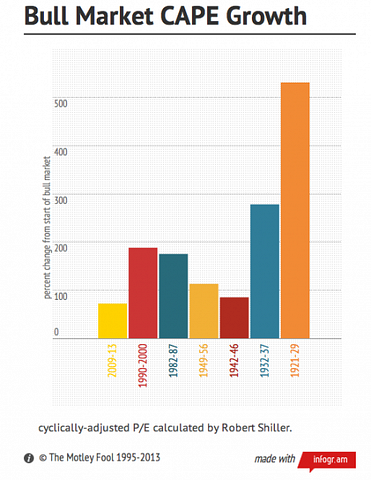
Bull Market CAPE Growth | Create infographics.
While this bull market has experienced less growth in CAPE than six other periods, it’s still the seventh-greatest CAPE expansion of any bull market in the Dow’s history. However, what may be more important is the actual CAPE that a bull market starts with, versus its final valuation before a reversal.
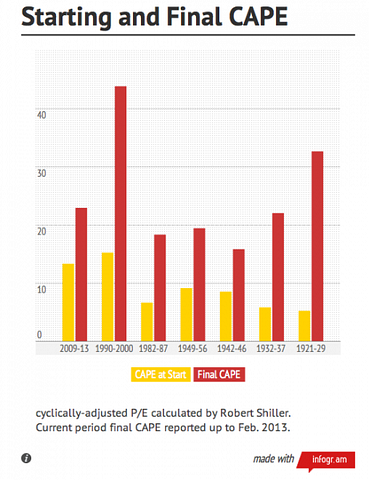
Starting and Final CAPE | Create infographics.
Only two market periods ended with a higher final CAPE than the market has right now, and only one of them began with a higher CAPE as well. The 1920s and the 1990s were both great times for investors, but both were followed by extended periods of poor index performance. Growth will be sustainable only if investors continue to believe in the potential of many stocks even as they continue to reach multiyear valuation highs, or so long as earnings continue to grow. Most likely, it would take a combination of both factors. It could happen, but it may not be in the cards for 2013. FactSet’s latest earnings insight now sees more than three times as many instances of negative earnings guidance as it does instances of positive guidance for this quarter.
What do you think about the Dow’s new record? Will this be the year the Dow rallies past its real heights for good, or will we have to endure another long decline before things turn up for the long haul?
The article Is the Dow’s All-Time High a Good Omen — or a Warning Sign? originally appeared on Fool.com.
Fool contributor Alex Planes holds no financial position in any company mentioned here. Add him on Google+ or follow him on Twitter @TMFBiggles for more insight into markets, history, and technology.The Motley Fool has no position in any of the stocks mentioned.
Copyright © 1995 – 2013 The Motley Fool, LLC. All rights reserved. The Motley Fool has a disclosure policy.


