The Treasury market is undergoing major reconstruction. Today’s investors tend to be momentum traders. They trade with the masses on current data, policies, and news releases. As a result, major market swings occur. And, with extremely low interest rates dictated by the Fed, the bond market is going wild.
Unprecedented numbers
The U.S. Department of Treasury’s website shows daily treasury yield curve rates dating back to Jan 1, 1990. A quick glance over the past six years shows just how low interest rates are being artificially held.
| 5/1/2008 | 5/1/2009 | 5/3/2010 | 5/2/2011 | 5/1/2012 | 5/1/2013 | 6/5/2013 | |
|---|---|---|---|---|---|---|---|
| 10 Year Treasury Yield | 3.78 | 3.29 | 3.72 | 3.31 | 1.98 | 1.66 | 2.1 |
The Fed is considering easing off the gas, as evidenced in the June yield. As a result, bond investors and long term income seekers are stuck in unknown territory.
Interest rates rise, bond prices fall
PowerShares Build America Bond ETF invests nearly 80% of its portfolio in bonds that comprise Bank of America’s Merrill Lynch Build America Bond Index. As seen by the below image, this particular ETF has fared well compared to its counterparts.
| YTD | 1 Year | 3 Year | |
|---|---|---|---|
| BofA Merrill Lynch Build America Bond Index | 1.14 | 9.42 | 12.92 |
| BofA Merrill Lynch U.S. Treasuries 15+ Years Index | -2.71 | 7.34 | 13.03 |
| BofA Merrill Lynch U.S. Corporate Master Index | 0.05 | 7.79 | 8.16 |
| Barclays U.S. Aggregate Index | -0.12 | 3.77 | 5.52 |
Given the inverse relationship between interest rates and bond prices, the Build America Bond ETF would drop 10.7% for each 1% increase in interest rates. Since interest rates increased nearly 0.5% in the past month, the investment does not look favorable. If the ytm were much higher, the risk-return trade-off may be worth the investment. But, as described here, REITs could be a beneficial alternative.The fund offers a yield to maturity of 5.07% and costs 0.56% given an expense ratio and management fee of 0.28%. It basically costs investors $56 per each $10,000 invested. However, with a duration of 10.7 years, this particular ETF is quite risky.
Investment grade bonds take a hit
Low yield, high rated bonds from large, stable firms have been extremely popular on the assumption that the investment is safe. It makes sense given the strong balance sheets and financial viability of firms like McDonald’s Corporation (NYSE:MCD)‘s, NIKE, Inc. (NYSE:NKE), and Microsoft Corporation (NASDAQ:MSFT). But, when U.S. Treasury bonds sell—like last Tuesday—the low yields cause some investors to cringe.
Morningstar gives McDonald’s Corporation (NYSE:MCD) a 4-star investment grade and an AA- bond rating. With $10.3 billion in outstanding debt, McDonald’s is funded 45.7% by debt. The remainder is equity. Even though all McDonald’s Corporation (NYSE:MCD) bonds receive a high credit rating, they may not be a great investment choice given their low ytm. However, McDonald’s does offer the Corp Med Term bond due in July 2018 that pays a coupon of 7.14% and a ytm of 7.25%. With a price of 99.3, the bond is selling at a small discount and is the best bond McDonald’s Corporation (NYSE:MCD) offers.
Industry giant Microsoft Corporation (NASDAQ:MSFT) is funded 15.6% by debt and boasts a AAA bond rating. However, its highest yielding bond matures in 2039, sells at a premium, pays a coupon of 5.2%, and offers a 4.4% ytm. Further, long term bonds are more sensitive to market fluctuations. Compared to other investment grade firms, Microsoft’s bonds are not good—especially if the Fed lets interest rates rise.
NIKE, Inc. (NYSE:NKE)’s capital structure is only financed 2.9% by debt. As a result, Nike’s bond offerings are not nearly as extensive as McDonald’s Corporation (NYSE:MCD) or Microsoft Corporation (NASDAQ:MSFT). The following image from Morningstar lists all of Nike’s outstanding bonds.
| Name | Maturity Date | Amount $(Mil) | Credit Quality | Price | Coupon % | Coupon Type | Callable | Yield to Maturity % |
|---|---|---|---|---|---|---|---|---|
| Nike | 5/1/2023 | 500 | — | 95.8 | 2.25 | Fixed | No | 2.74 |
| Nike | 5/1/2043 | 500 | — | 92.3 | 3.625 | Fixed | No | 4.07 |
| Nike Inc (NYSE:NKE) Mtn Be 5.15% | 10/15/2015 | 100 | High | 109.1 | 5.15 | Fixed | No | 1.22 |
| Nike Inc Mtn Be 4.7% | 10/1/2013 | 50 | High | 102.5 | 4.7 | Fixed | No | 0.19 |
As seen by Morningstar’s chart below, NIKE, Inc. (NYSE:NKE) may be a good long term buy and hold for growth given its market dominance, revenue growth, operating efficiencies, and low beta of 0.78. However, it seems to be overvalued. For example, its total enterprise value is only about $51.4 billion whereas its total market cap is about $55.04 billion. However, investors must take Nike’s capital structure into consideration. It is barely financed through debt and is a large growth stock.
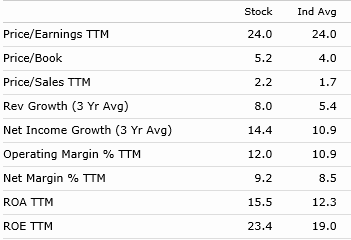
Regardless, investors should avoid Nike bonds.
Lower grade, better choice
Lower grade bond prices are not as strongly correlated to interest rate increases as higher grade bonds. As a result, investors may look toward lower grade bonds given the market condition.
General Motors Company (NYSE:GM), for example, only has a BB bond rating. Due to its duration, General Motors Company (NYSE:GM) bond holders are more likely to avoid large paper losses if interest rates rise. For example, if rates increase from current levels of about 2% to 3%, General Motors Company (NYSE:GM) bond holders would only recognize a price decline of about 7%. As seen in the above instance, Build America Bond ETF bond holders would notice a 10.7% drop.
Conclusion
The Fed’s next steps are unknown. However, at the slightest upward movement of interest rates, bondholders may try to pitch investment grade bonds. Therefore, income seeking investors who want to avoid paper losses should consider REITS or lower grade bonds like General Motors Company (NYSE:GM).
Brendan Marasco has no position in any stocks mentioned. The Motley Fool recommends General Motors Company (NYSE:GM), McDonald’s Corporation (NYSE:MCD), and NIKE, Inc. (NYSE:NKE). The Motley Fool owns shares of McDonald’s, Microsoft Corporation (NASDAQ:MSFT), and Nike.
The article Boom or Bust, You Decide originally appeared on Fool.com.
Brendan is a member of The Motley Fool Blog Network — entries represent the personal opinion of the blogger and are not formally edited.
Copyright © 1995 – 2013 The Motley Fool, LLC. All rights reserved. The Motley Fool has a disclosure policy.


