Copart, Inc. (NASDAQ:CPRT) recently reported its preliminary financial results based on which we provide a unique peer-based analysis of the company. Our analysis is based on the company’s performance over the last twelve months (unless stated otherwise). For a more detailed analysis of this company (and over 40,000 other global equities) please visitwww.capitalcube.com.
Copart Inc.’s analysis versus peers uses the following peer-set: CarMax, Inc (NYSE:KMX), AutoNation, Inc. (NYSE:AN), Penske Automotive Group, Inc. (NYSE:PAG), Group 1 Automotive, Inc. (NYSE:GPI), Sonic Automotive Inc (NYSE:SAH) and America’s Car-Mart, Inc. (NASDAQ:CRMT). The table below shows the preliminary results along with the recent trend for revenues, net income and returns.

Valuation Drivers
Copart Inc. currently trades at a higher Price/Book ratio (6.2) than its peer median (4.2). CPRT-US achieved a better operating performance than the median of its chosen peers (ROE of 32.6% compared to the peer median ROE of 16.2%) and the market still expects faster growth from it than from those peers (PE of 19.8 compared to peer median of 15.6).
The company’s relatively high profit margins (currently 19.7% vs. peer median of 2.0%) are burdened by asset inefficiency with asset turns of 0.8x compared to the peer median of 2.4x. Overall, this suggests a margin driven operating model relative to its peers. CPRT-US’s net margin is less than (but within one standard deviation of) its five-year average net margin of 20.4%.
Economic Moat
Changes in the company’s annual top line and earnings (6.0% and 9.5% respectively) generally lag its peers. This implies a lack of strategic focus and/or inability to execute. We view such companies as laggards relative to peers.
CPRT-US’s return on assets is above its peer median both in the current period (16.3% vs. peer median 4.7%) and also over the past five years (14.8% vs. peer median 1.8%). This performance suggests that the company’s relatively high operating returns are sustainable.
The company’s comparatively healthy gross margin of 47.9% versus peer median of 15.5% suggests that it has a differentiated strategy with pricing advantages. Further, CPRT-US’s bottom-line operating performance is better than peer median (pre-tax margins of 30.1% compared to peer median 3.2%) suggesting relatively tight control on operating costs.
Growth & Investment Strategy
While CPRT-US’s revenues growth has been around the peer median in recent years (7.5% vs. 7.5% respectively for the past three years), the market gives its shares a higher than peer median PE ratio of 19.8. The market seems to see faster growth ahead.
CPRT-US’s annualized rate of change in capital of 2.9% over the past three years is around the same as its peer median of 2.9%. This investment has generated a better than peer median return on capital of 16.8% averaged over the same three years. The greater than peer median rate of return suggest that the company may be under investing in growth.
Earnings Quality
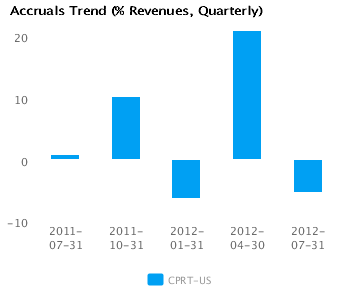
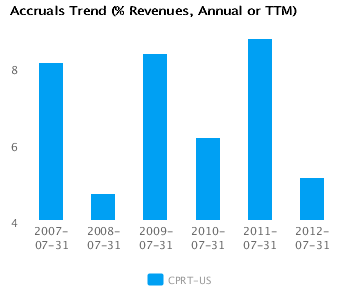
CPRT-US has reported relatively strong net income margin for the last twelve months (19.7% vs. peer median of 2.0%). This margin performance combined with relatively high accruals (5.1% vs. peer median of -1.8%) suggests possible conservative accounting and an understatement of its reported net income.
CPRT-US’s accruals over the last twelve months are positive suggesting a buildup of reserves. In addition, the level of accrual is greater than the peer median — which suggests a relatively strong buildup in reserves compared to its peers.
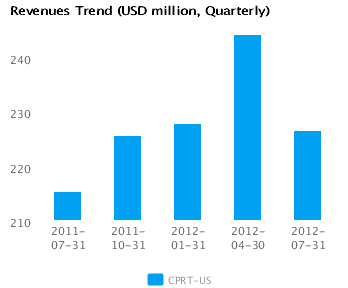
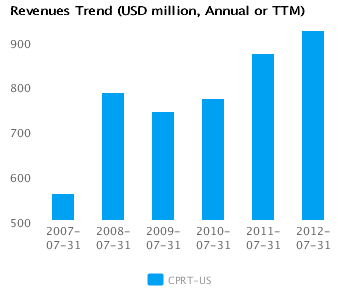
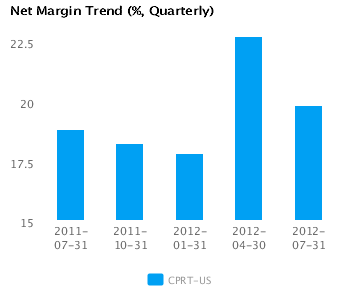
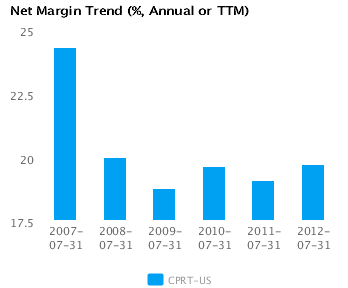
Trend Charts