Norfolk Southern Corp.’s analysis versus peers uses the following peer-set: Union Pacific Corporation (NYSE:UNP), Canadian National Railway (NYSE:CNI), CSX Corporation (NYSE:CSX), Canadian Pacific Railway Limited (NYSE:CP), Daqin Railway Co., Ltd. (SHA:601006), QR National (ASX:QRN), Kansas City Southern (NYSE:KSU), Tobu Railway Co Ltd (TYO:9001), Genesee & Wyoming Inc. (NYSE:GWR) and Globaltrans Investment PLC (LON:GLTR). The table below shows the preliminary results along with the recent trend for revenues, net income and returns.
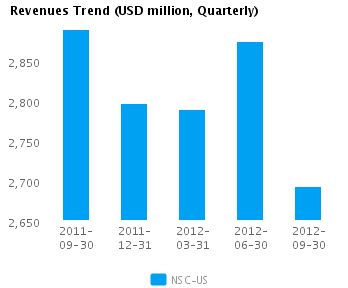
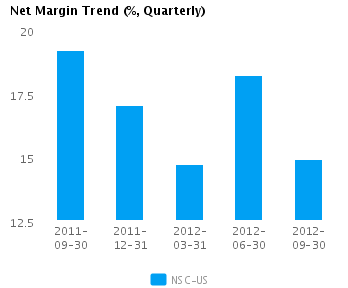
| Quarterly (USD million) | 2012-09-30 | 2012-06-30 | 2012-03-31 | 2011-12-31 | 2011-09-30 |
|---|---|---|---|---|---|
| Revenues | 2,693.0 | 2,874.0 | 2,789.0 | 2,797.0 | 2,889.0 |
| Revenue Growth % | (6.3) | 3.0 | (0.3) | (3.2) | 0.8 |
| Net Income | 402.0 | 524.0 | 410.0 | 477.0 | 554.0 |
| Net Income Growth % | (23.3) | 27.8 | (14.0) | (13.9) | (0.5) |
| Net Margin % | 14.9 | 18.2 | 14.7 | 17.1 | 19.2 |
| ROE % (Annualized) | 16.5 | 21.4 | 16.5 | 18.9 | 21.2 |
| ROA % (Annualized) | 5.4 | 7.2 | 5.6 | 6.6 | 7.8 |
Valuation Drivers
Norfolk Southern Corp.’s current Price/Book of 2.2 is about median in its peer group. The market expects less growth from NSC-US than the median of its chosen peers (PE of 11.9 compared to peer median of 15.4) and for its current rates of return that are around peer median (ROE of 18.1%) to decline.
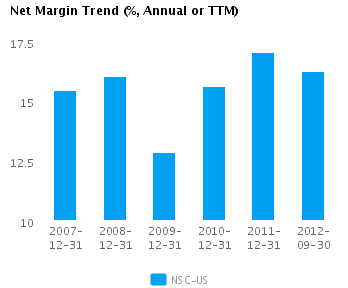
The company’s asset efficiency (asset turns of 0.4x) and net profit margins of 16.3% are both median for its peer group. NSC-US’s net margin has declined 0.8 percentage points from last year’s high but remains above its five-year average net margin of 15.4.
Economic Moat
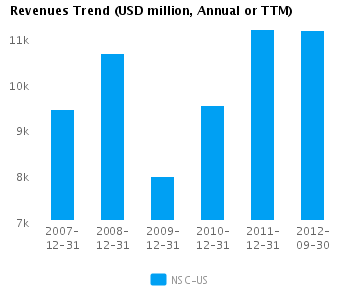
The company enjoys both better than peer median annual revenue growth of 17.4% and better than peer median earnings growth performance 28.2%. NSC-US currently converts every 1% of change in annual revenue into 1.6% of change in annual reported earnings. We view this company as a leader among its peers.
NSC-US’s return on assets currently is around peer median (6.2% vs. peer median 6.2%) — similar to its returns over the past five years (5.5% vs. peer median 5.4%). This performance suggests that the company has no specific competitive advantages relative to its peers.
The company’s gross margin of 38.9% is around peer median suggesting that NSC-US’s operations do not benefit from any differentiating pricing advantage. In addition, NSC-US’s pre-tax margin of 25.4% is also around the peer median suggesting no operating cost advantage relative to peers.
Growth & Investment Strategy
NSC-US’s revenues have grown more slowly than the peer median over the last few years (1.6% vs. 4.5% respectively for the past three years) and the stock price’s relatively low PE ratio of 11.9 implies relatively low future growth as well. Overall, we view the company’s growth expectations as substandard relative to its peers.
NSC-US’s annualized rate of change in capital of 2.4% over the past three years is less than its peer median of 4.2%. This investment has generated a peer median return on capital of 8.5% averaged over the same three years. The median return on capital investment on a relatively lower investment suggests that the company is under investing.
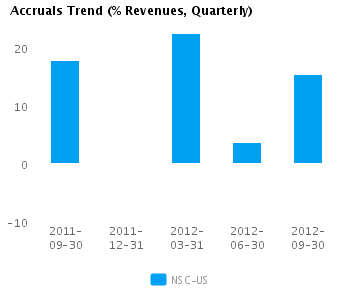
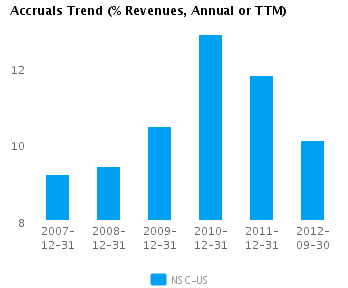
Earnings Quality
NSC-US’s net income margin for the last twelve months is around the peer median (16.3% vs. peer median of 15.9%). This average margin combined with a level of accruals that is around peer median (10.1% vs. peer median of 10.1%) suggests there possibly isn’t too much accrual movement flowing into the company’s reported earnings.
NSC-US’s accruals over the last twelve months are positive suggesting a buildup of reserves. However, this level of accruals is also around the peer median and suggests the company is recording a proper level of reserves compared to its peers.
Trend Charts