Mosaic Co (NYSE:MOS) recently reported its preliminary financial results based on which we provide a unique peer-based analysis of the company. Our analysis is based on the company’s performance over the last twelve months (unless stated otherwise). For a more detailed analysis of this company (and over 40,000 other global equities) please visit www.capitalcube.com.
Mosaic Co.’s analysis versus peers uses the following peer-set: Potash Corp./Saskatchewan (NYSE:POT), Agrium Inc. (NYSE:AGU), ISRAEL CHEIMICALS SHS (PINK:ISCHF), CF Industries Holdings, Inc. (NYSE:CF), K PLUS S AG S (PINK:KPLUY) and Intrepid Potash, Inc. (NYSE:IPI). The table below shows the preliminary results along with the recent trend for revenues, net income and returns.

Valuation Drivers
Mosaic Co.’s current Price/Book of 1.9 is about median in its peer group. The market expects MOS-US to grow earnings about as fast as the median of its chosen peers (PE of 12.8 compared to peer median of 12.1) but not to expect much improvement in its below peer median rates of return (ROE of 14.8% compared to the peer median ROE of 24.2%).
The company’s asset efficiency (asset turns of 0.6x) and net profit margins of 17.4% are both median for its peer group. MOS-US’s net margin is less than (but within one standard deviation of) its four-year average net margin of 19.8%.
Economic Moat
Changes in the company’s annual top line and earnings (11.8% and -23.2% respectively) generally lag its peers. This implies a lack of strategic focus and/or inability to execute. We view such companies as laggards relative to peers.
MOS-US’s return on assets currently is around peer median (11.0% vs. peer median 11.7%) — similar to its returns over the past five years (15.0% vs. peer median 15.0%). This performance suggests that the company has no specific competitive advantages relative to its peers.
The company’s comparatively low gross margins of 33.6% versus peer median of 46.8% suggests that it has a non-differentiated strategy or is in a pricing constrained position. However, MOS-US’s pre-tax margin of 23.6% is around the peer median which, when combined with the gross margin, suggests lower operating costs relative to peers.
Growth & Investment Strategy
MOS-US’s revenues have grown at about the same rate as its peers (2.6% vs. 2.2% respectively for the past three years). Similarly, the stock price implies median long-term growth as its PE ratio is around the peer median of 12.8. Thehistorical performance and long-term growth expectations for the company are largely in sync.
MOS-US’s annualized rate of change in capital of 9.7% over the past three years is around its peer median of 11.5%. This median investment has likewise generated a peer median return on capital of 15.2% averaged over the same three years. This median return on investment implies that company is investing appropriately.
Earnings Quality
MOS-US’s net income margin for the last twelve months is around the peer median (17.4% vs. peer median of 21.0%). This average margin and relatively conservative accrual policy (6.2% vs. peer median of 5.1%) suggests possible understatement of its reported net income.
MOS-US’s accruals over the last twelve months are positive suggesting a buildup of reserves. In addition, the level of accrual is greater than the peer median — which suggests a relatively strong buildup in reserves compared to its peers.
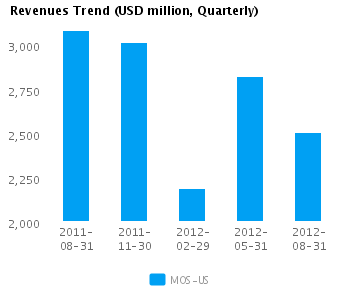
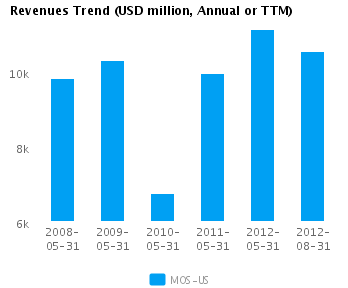
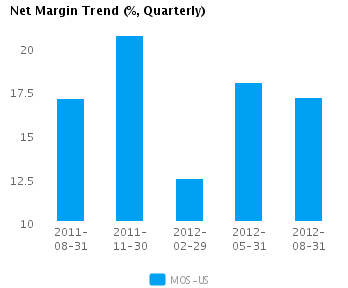
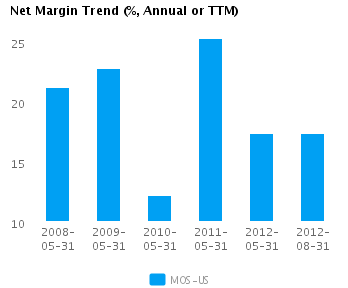
Trend Charts