
Lowe’s Companies, Inc. (NYSE:LOW) analysis versus peers uses the following peer-set: The Home Depot, Inc. (NYSE:HD), Kingfisher plc (PINK:KGFHY), Lumber Liquidators Holdings Inc (NYSE:LL), RONA Inc. (TSE:RON), KOMERI CO., LTD. (TYO:8218), Hornbach-Baumarkt-AG (ETR:HBM), DCM Holdings Co., Ltd (TYO:3050) and Bricorama SA (EPA:ALBRI). The table below shows the preliminary results along with the recent trend for revenues, net income and returns.
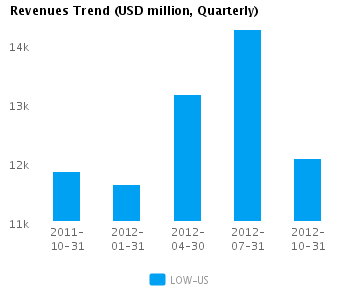
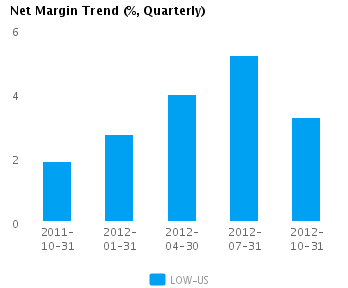
| Quarterly (USD million) | 2012-10-31 | 2012-07-31 | 2012-04-30 | 2012-01-31 | 2011-10-31 |
|---|---|---|---|---|---|
| Revenues | 12,073.0 | 14,249.0 | 13,153.0 | 11,629.0 | 11,852.0 |
| Revenue Growth % | (15.3) | 8.3 | 13.1 | (1.9) | (18.5) |
| Net Income | 393.0 | 742.0 | 524.0 | 319.0 | 223.0 |
| Net Income Growth % | (47.0) | 41.6 | 64.3 | 43.0 | (72.9) |
| Net Margin % | 3.3 | 5.2 | 4.0 | 2.7 | 1.9 |
| ROE % (Annualized) | 10.8 | 19.8 | 13.2 | 7.7 | 5.3 |
| ROA % (Annualized) | 4.6 | 8.2 | 5.9 | 3.8 | 2.6 |
Valuation Drivers
Lowe’s Cos.’s current Price/Book of 2.9 is about median in its peer group. LOW-US achieved a better operating performance than the median of its chosen peers (ROE of 12.7% compared to the peer median ROE of 8.8%) and the market still expects faster growth from it than from those peers (PE of 21.6 compared to peer median of 11.0).
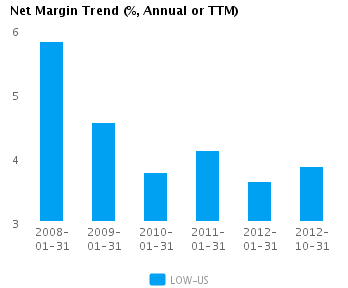
The company’s asset efficiency (asset turns of 1.5x) and net profit margins of 3.9% are both median for its peer group. LOW-US’s net margin is similar to last year’s low of 3.6%, which compares to the 2008 high of 5.8%.
Economic Moat
Changes in the company’s annual top line and earnings (2.9% and -9.3% respectively) generally lag its peers. This implies a lack of strategic focus and/or inability to execute. We view such companies as laggards relative to peers.
LOW-US’s return on assets is above its peer median both in the current period (5.8% vs. peer median 4.2%) and also over the past five years (6.7% vs. peer median 4.4%). This performance suggests that the company’s relatively high operating returns are sustainable.
The company’s gross margin of 34.5% is around peer median suggesting that LOW-US’s operations do not benefit from any differentiating pricing advantage. In addition, LOW-US’s pre-tax margin of 6.2% is also around the peer median suggesting no operating cost advantage relative to peers.
Growth & Investment Strategy
While LOW-US’s revenues growth has been around the peer median in recent years (1.3% vs. 1.3% respectively for the past three years), the market gives its shares a higher than peer median PE ratio of 21.6. The market seems to see faster growth ahead.
LOW-US’s annualized rate of change in capital of 0.06% over the past three years is less than its peer median of 1.6%. This investment has generated a peer median return on capital of 7.7% averaged over the same three years. The median return on capital investment on a relatively lower investment suggests that the company is under investing.
Earnings Quality
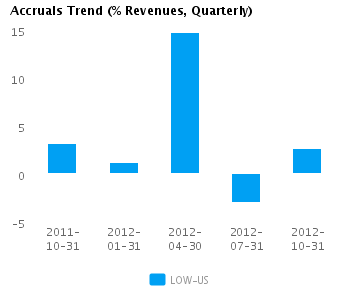
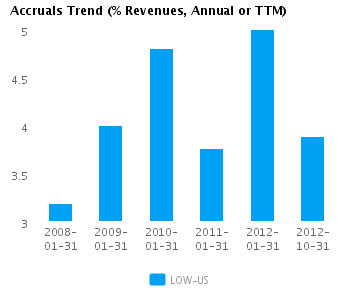
LOW-US’s net income margin for the last twelve months is around the peer median (3.9% vs. peer median of 3.3%). This average margin and relatively conservative accrual policy (3.9% vs. peer median of 1.0%) suggests possible understatement of its reported net income.
LOW-US’s accruals over the last twelve months are positive suggesting a buildup of reserves. In addition, the level of accrual is greater than the peer median — which suggests a relatively strong buildup in reserves compared to its peers.
Trend Charts
Company Profile
Disclaimer
This article was originally written by abha.dawesar, and posted on CapitalCube.


